SOV


Location

lon / lat [deg]: 46.41 / 24.91

Source network: BSRN


Geostationary surface albedo (GSA) data


“+000”


“+057/+063”


Landcover information (based on ESA CCI landcover data)


Landcover fractions @ 2km distance


Landcover fractions @ 20 km distance


Legend


Distance to open water bodies [km]:

55.94

Distance to urban areas [km]:

2.6


Radius: 1 km

Number of landcover classes:

2

Dominant landcover type:

200: bare areas

Fraction of dominant landcover type [%]:

94.0


Radius: 2 km

Number of landcover classes:

2

Dominant landcover type:

200: bare areas

Fraction of dominant landcover type [%]:

83.0


Radius: 5 km

Number of landcover classes:

3

Dominant landcover type:

200: bare areas

Fraction of dominant landcover type [%]:

87.0


Radius: 10 km

Number of landcover classes:

3

Dominant landcover type:

200: bare areas

Fraction of dominant landcover type [%]:

95.0


Radius: 20 km

Number of landcover classes:

2

Dominant landcover type:

200: bare areas

Fraction of dominant landcover type [%]:

97.0


Disturbances


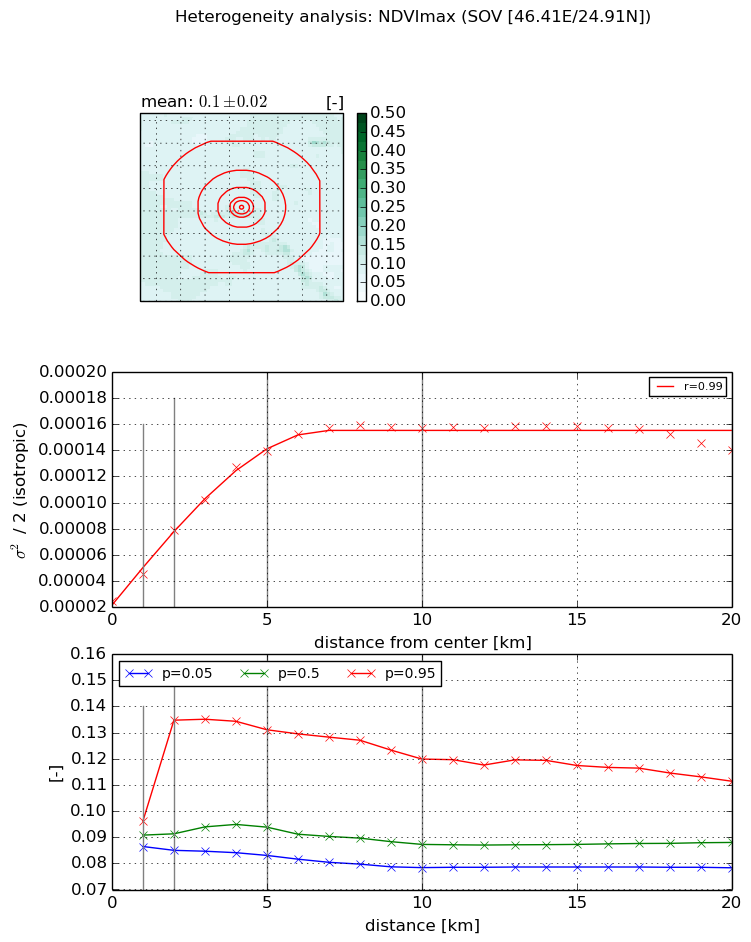
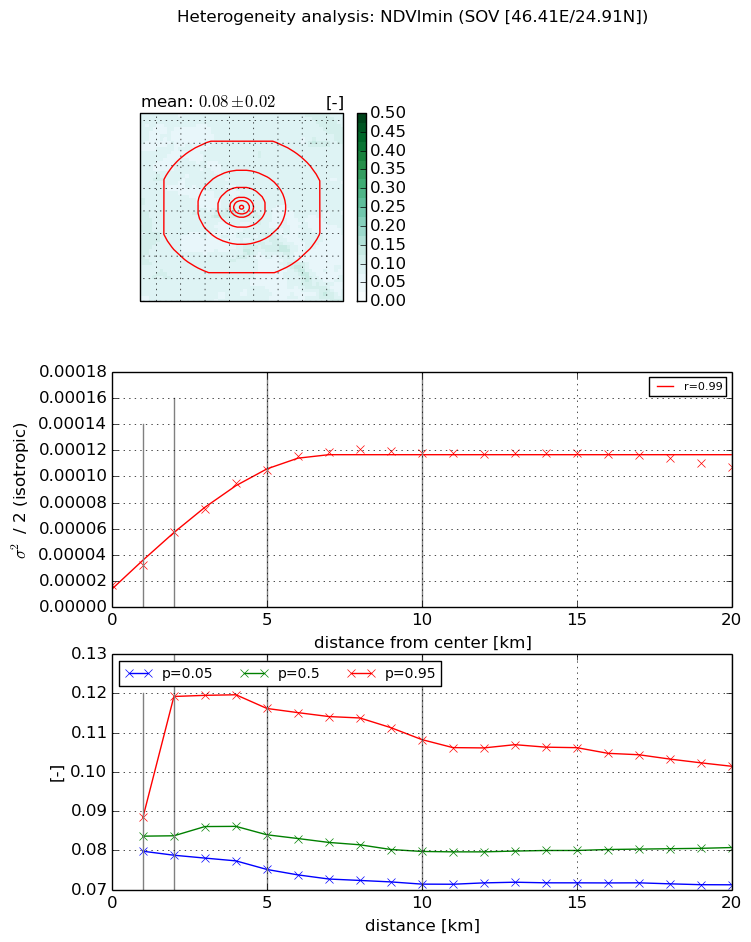
Heterogeneity analysis

The heterogeneity analysis provides information about the spatial and temporal heterogeneity of the site.

Topography


Roman et al. (2009) index


St

2.64053788972

Rcv

0.341300707184

Rse

0.0

Rst

0.0426605419013

Rsv

0.752170904778


Height range @ 1km [m]

42

Height range @ 2km [m]

47

Height range @ 5km [m]

70

Height range @ 10km [m]

-999

Height range @ 20km [m]

-999


Variance slope @ 1 km

116

Variance slope @ 2 km

118

Variance slope @ 5 km

122

Variance slope @ 10 km

-999

Variance slope @ 20 km

-999


NDVI (max. NDVI composite)


Roman et al. (2009) index


St

2.43601137263

Rcv

-0.125636674776

Rse

0.0

Rst

0.768477156707

Rsv

-0.337407512672


NDVI range @ 1km [-]

0.01

NDVI range @ 2km [-]

0.05

NDVI range @ 5km [-]

0.05

NDVI range @ 10km [-]

0.04

NDVI range @ 20km [-]

0.03


Variance slope @ 1 km

2.08699840135e-05

Variance slope @ 2 km

2.74400858669e-05

Variance slope @ 5 km

2.41171882052e-05

Variance slope @ 10 km

1.35333063848e-05

Variance slope @ 20 km

4.31372685096e-06


NDVI (min. NDVI composite)I


Roman et al. (2009) index


St

2.86621967922

Rcv

-0.0875891147253

Rse

0.0

Rst

0.930192608218

Rsv

0.0288931086302


NDVI range @ 1km [-]

0.01

NDVI range @ 2km [-]

0.04

NDVI range @ 5km [-]

0.04

NDVI range @ 10km [-]

0.04

NDVI range @ 20km [-]

0.03


NDVI slope @ 1 km

1.50067030902e-05

NDVI slope @ 2 km

2.01697050548e-05

NDVI slope @ 5 km

1.85553496936e-05

NDVI slope @ 10 km

1.04968120852e-05

NDVI slope @ 20 km

3.3086665266e-06


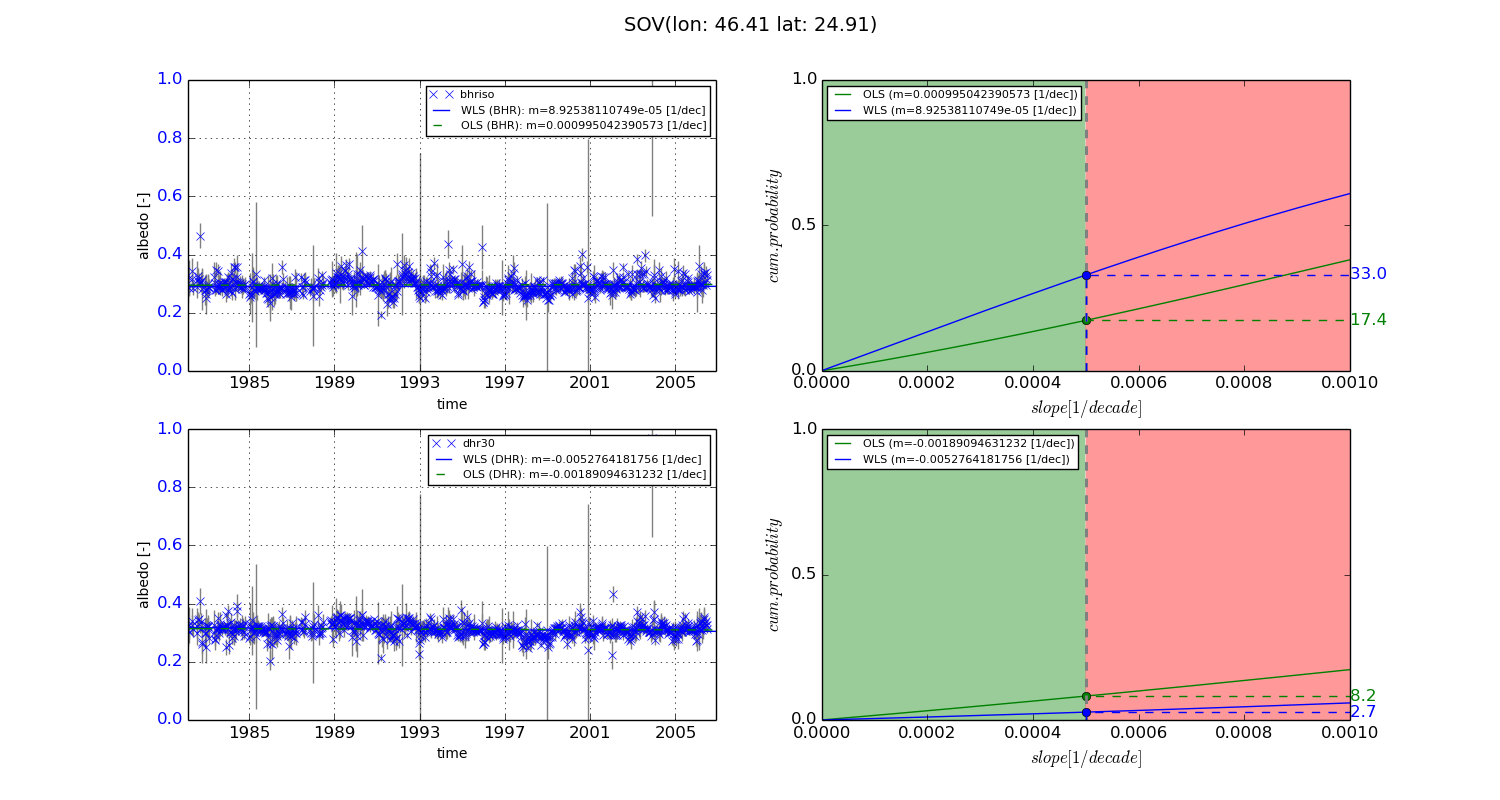
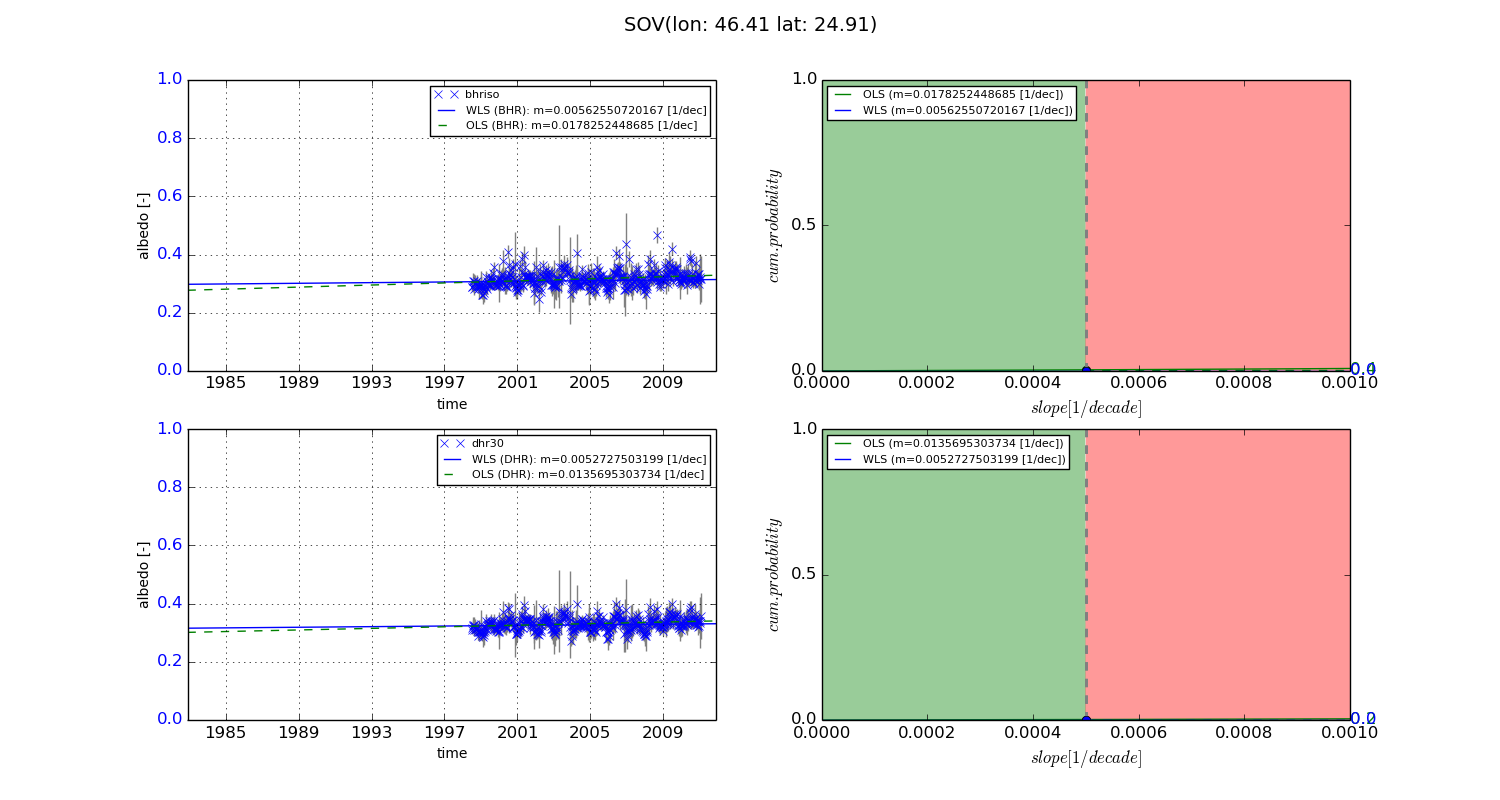
Temporal stability analysis

+000 deg (BHR)


BHR statistics

Temporal stability [1/decade]:


abs

rel


Weighted least square:

8.92538110749e-05


Ordinary least square:

0.000995042390573


Probabilities that GCOS criteria is met:

Weighted least square:

33.0 %

Ordinary least square:

17.4 %


DHR statistics

Temporal stability [1/decade]:


abs

rel


Weighted least square:

-0.0052764181756


Ordinary least square:

-0.00189094631232


Probabilities that GCOS criteria is met:

Weighted least square:

2.7 %

Ordinary least square:

8.2 %


+057/+063 deg (BHR)


BHR statistics

Temporal stability [1/decade]:


abs

rel


Weighted least square:

0.00562550720167


Ordinary least square:

0.0178252448685


Probabilities that GCOS criteria is met:

Weighted least square:

0.0 %

Ordinary least square:

0.4 %


DHR statistics

Temporal stability [1/decade]:


abs

rel


Weighted least square:

0.0052727503199


Ordinary least square:

0.0135695303734


Probabilities that GCOS criteria is met:

Weighted least square:

0.0 %

Ordinary least square:

0.2 %


Temporal anomaly analyis

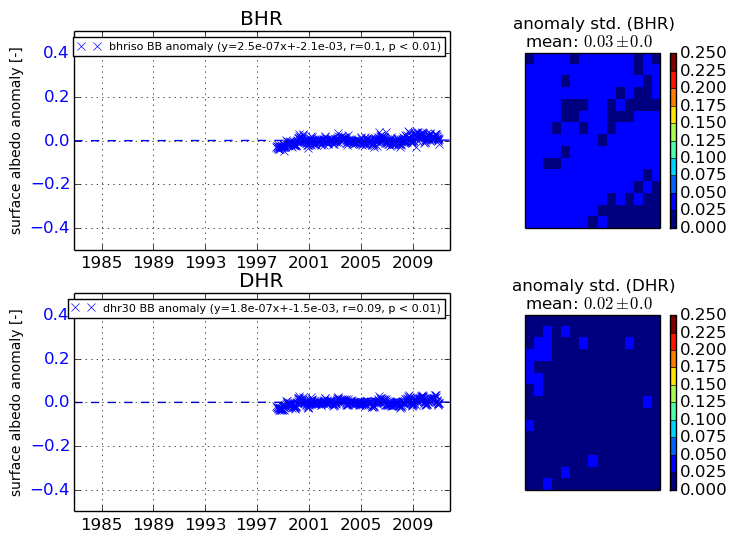
The variance of the temporal anomalies provides an additional measure about the stability of the signal AFTER removal of the mean seasonal cylce.
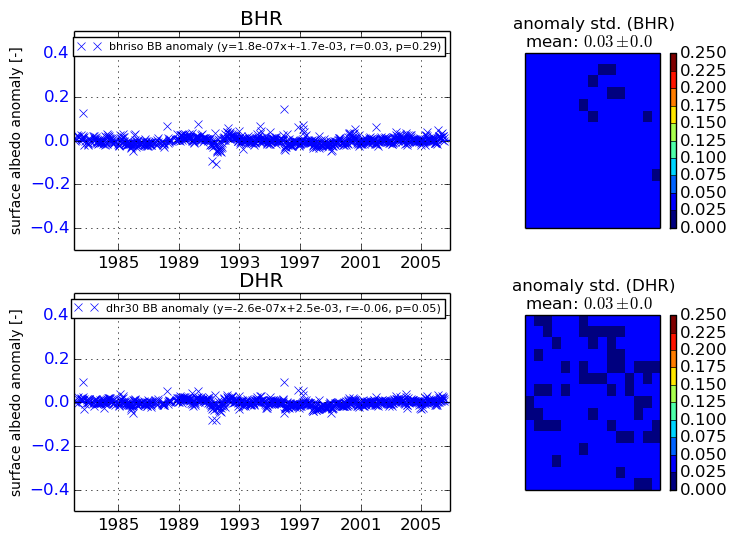
+000 deg


+057/+063 deg