STRZYZOW


Location

lon / lat [deg]: 21.8613 / 49.8786

Source network: AERONET


Geostationary surface albedo (GSA) data


“+000”


“+057/+063”


Landcover information (based on ESA CCI landcover data)


Landcover fractions @ 2km distance


Landcover fractions @ 20 km distance


Legend


Distance to open water bodies [km]:

7.32

Distance to urban areas [km]:

2.65


Radius: 1 km

Number of landcover classes:

2

Dominant landcover type:

10: cropland, rainfed

Fraction of dominant landcover type [%]:

94.0


Radius: 2 km

Number of landcover classes:

4

Dominant landcover type:

10: cropland, rainfed

Fraction of dominant landcover type [%]:

78.0


Radius: 5 km

Number of landcover classes:

7

Dominant landcover type:

10: cropland, rainfed

Fraction of dominant landcover type [%]:

75.0


Radius: 10 km

Number of landcover classes:

7

Dominant landcover type:

10: cropland, rainfed

Fraction of dominant landcover type [%]:

70.0


Radius: 20 km

Number of landcover classes:

7

Dominant landcover type:

10: cropland, rainfed

Fraction of dominant landcover type [%]:

69.0


Disturbances


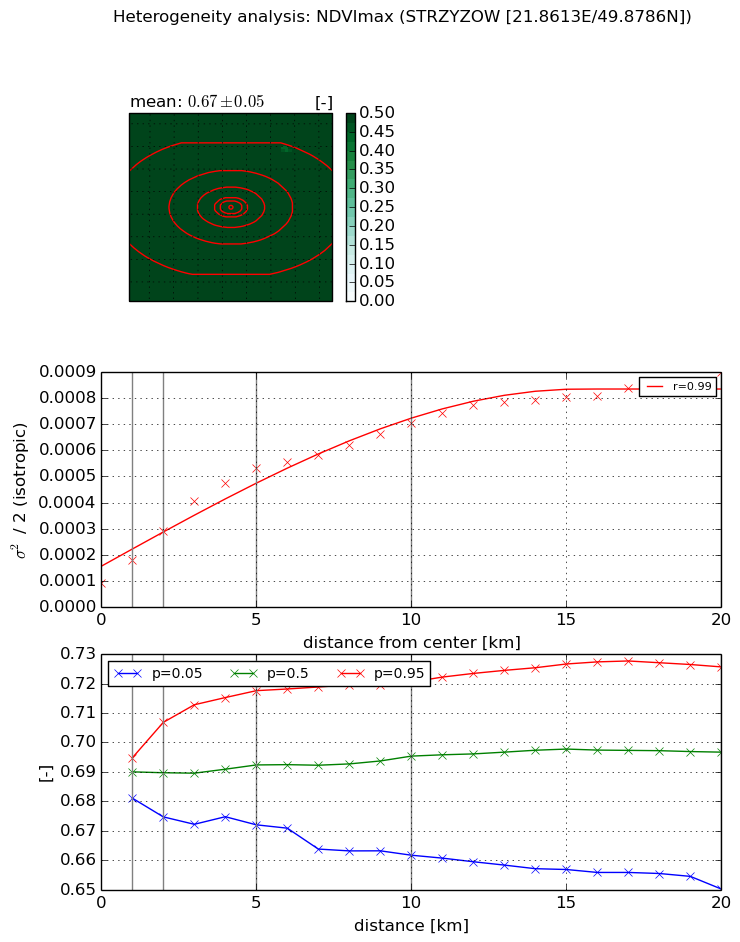
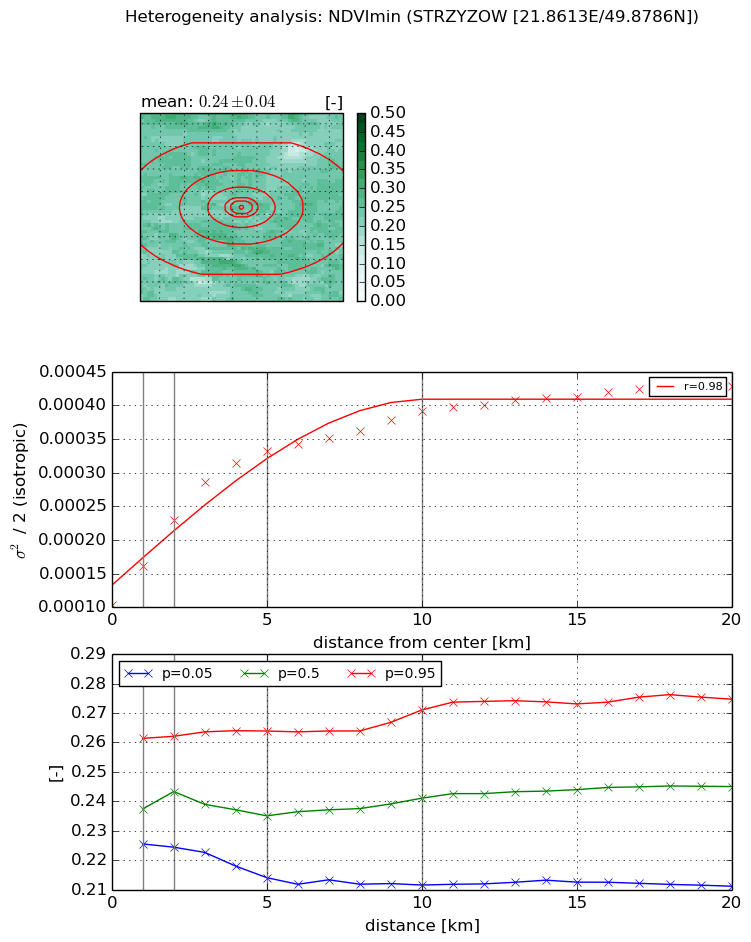
Heterogeneity analysis

The heterogeneity analysis provides information about the spatial and temporal heterogeneity of the site.

Topography


Roman et al. (2009) index


St

35.6732013894

Rcv

0.0154959369406

Rse

0.0

Rst

-0.0481024300259

Rsv

0.0204983746534


Height range @ 1km [m]

96

Height range @ 2km [m]

131

Height range @ 5km [m]

175

Height range @ 10km [m]

-999

Height range @ 20km [m]

-999


Variance slope @ 1 km

1432

Variance slope @ 2 km

1386

Variance slope @ 5 km

755

Variance slope @ 10 km

-999

Variance slope @ 20 km

-999


NDVI (max. NDVI composite)


Roman et al. (2009) index


St

nan

Rcv

nan

Rse

nan

Rst

nan

Rsv

nan


NDVI range @ 1km [-]

0.01

NDVI range @ 2km [-]

0.03

NDVI range @ 5km [-]

0.05

NDVI range @ 10km [-]

0.06

NDVI range @ 20km [-]

0.08


Variance slope @ 1 km

8.86610417354e-05

Variance slope @ 2 km

0.000101187695509

Variance slope @ 5 km

9.16960965739e-05

Variance slope @ 10 km

5.81372444547e-05

Variance slope @ 20 km

3.50975653316e-05


NDVI (min. NDVI composite)I


Roman et al. (2009) index


St

nan

Rcv

nan

Rse

nan

Rst

nan

Rsv

nan


NDVI range @ 1km [-]

0.04

NDVI range @ 2km [-]

0.04

NDVI range @ 5km [-]

0.05

NDVI range @ 10km [-]

0.06

NDVI range @ 20km [-]

0.06


NDVI slope @ 1 km

5.88588708945e-05

NDVI slope @ 2 km

6.34907333563e-05

NDVI slope @ 5 km

4.75885355759e-05

NDVI slope @ 10 km

2.61502170279e-05

NDVI slope @ 20 km

1.25527364578e-05


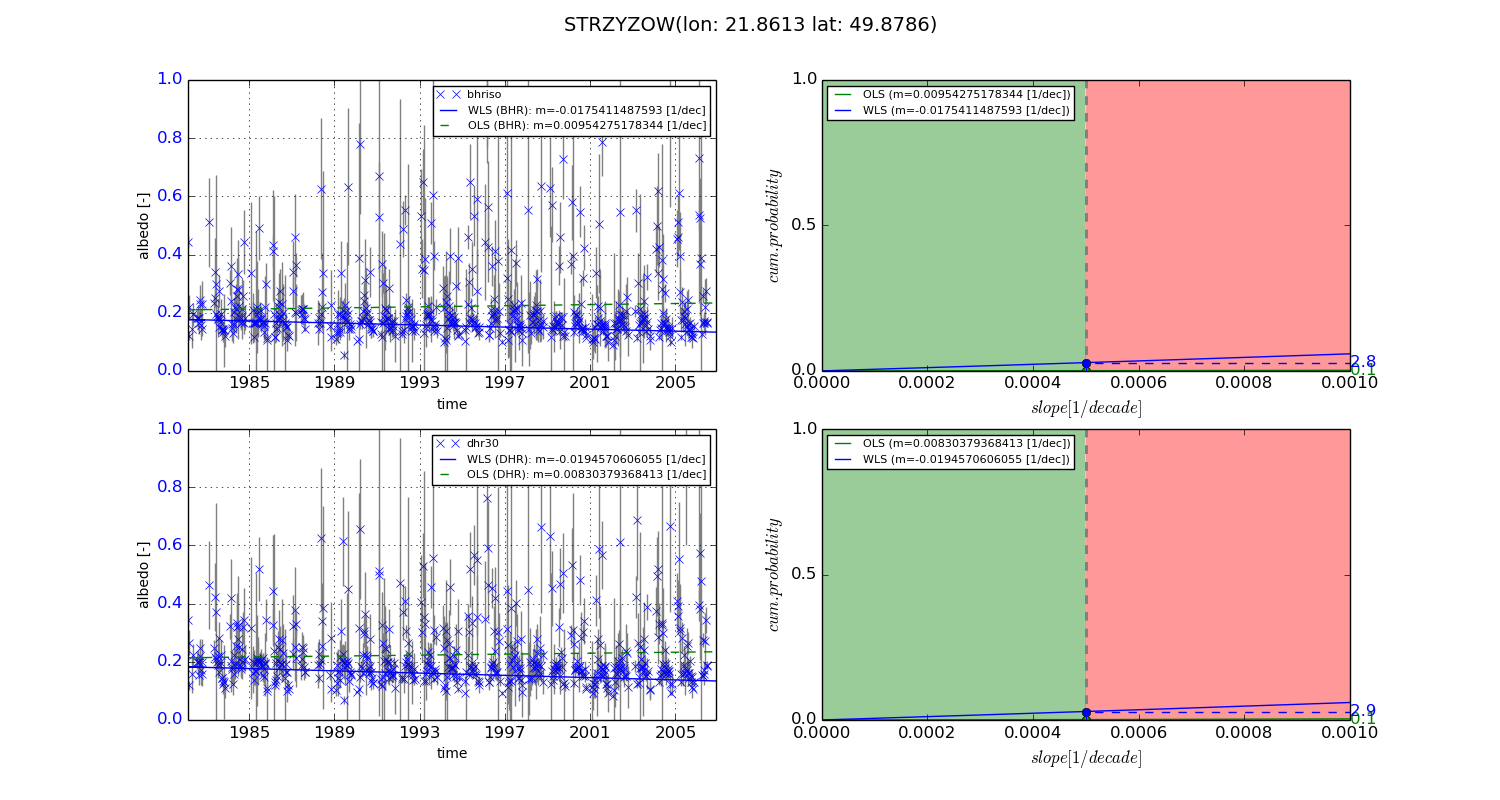
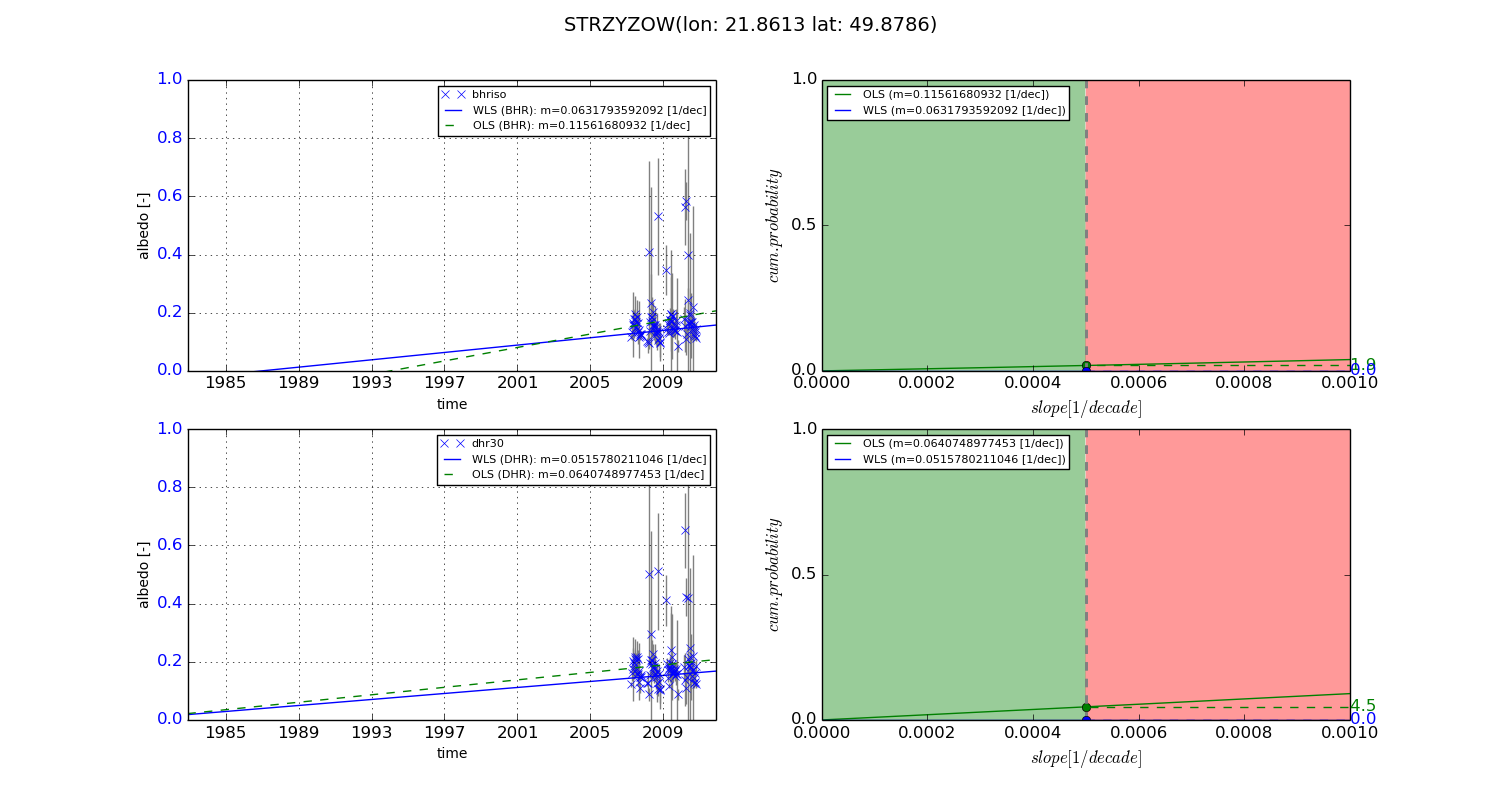
Temporal stability analysis

+000 deg (BHR)


BHR statistics

Temporal stability [1/decade]:


abs

rel


Weighted least square:

-0.0175411487593


Ordinary least square:

0.00954275178344


Probabilities that GCOS criteria is met:

Weighted least square:

2.8 %

Ordinary least square:

0.1 %


DHR statistics

Temporal stability [1/decade]:


abs

rel


Weighted least square:

-0.0194570606055


Ordinary least square:

0.00830379368413


Probabilities that GCOS criteria is met:

Weighted least square:

2.9 %

Ordinary least square:

0.1 %


+057/+063 deg (BHR)


BHR statistics

Temporal stability [1/decade]:


abs

rel


Weighted least square:

0.0631793592092


Ordinary least square:

0.11561680932


Probabilities that GCOS criteria is met:

Weighted least square:

0.0 %

Ordinary least square:

1.9 %


DHR statistics

Temporal stability [1/decade]:


abs

rel


Weighted least square:

0.0515780211046


Ordinary least square:

0.0640748977453


Probabilities that GCOS criteria is met:

Weighted least square:

0.0 %

Ordinary least square:

4.5 %


Temporal anomaly analyis

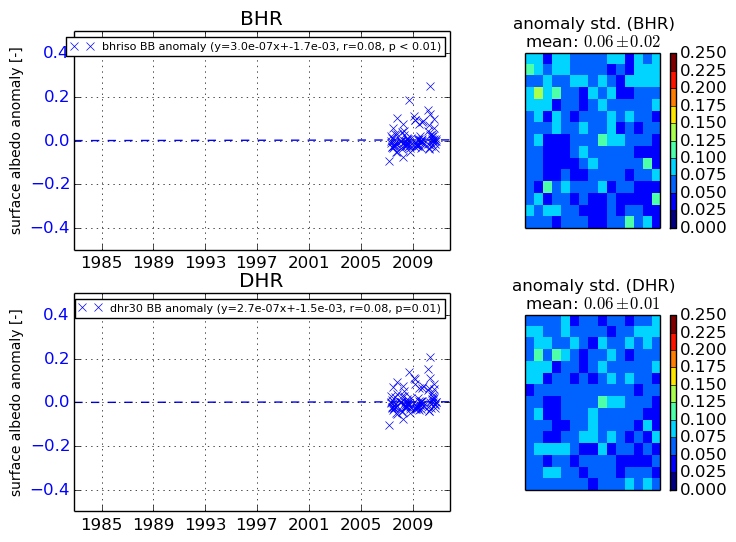
The variance of the temporal anomalies provides an additional measure about the stability of the signal AFTER removal of the mean seasonal cylce.
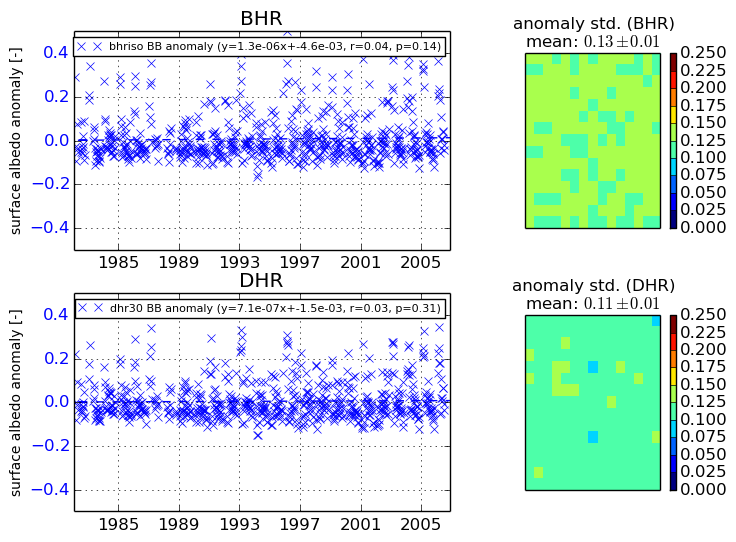
+000 deg


+057/+063 deg