SUA_PAN3


Location

lon / lat [deg]: 25.965 / -20.644

Source network: ALBEDOVAL2


Geostationary surface albedo (GSA) data


“+000”


“+057/+063”


Landcover information (based on ESA CCI landcover data)


Landcover fractions @ 2km distance


Landcover fractions @ 20 km distance


Legend


Distance to open water bodies [km]:

0.11

Distance to urban areas [km]:

none in region


Radius: 1 km

Number of landcover classes:

1

Dominant landcover type:

210: water bodies

Fraction of dominant landcover type [%]:

100.0


Radius: 2 km

Number of landcover classes:

1

Dominant landcover type:

210: water bodies

Fraction of dominant landcover type [%]:

100.0


Radius: 5 km

Number of landcover classes:

1

Dominant landcover type:

210: water bodies

Fraction of dominant landcover type [%]:

100.0


Radius: 10 km

Number of landcover classes:

1

Dominant landcover type:

210: water bodies

Fraction of dominant landcover type [%]:

100.0


Radius: 20 km

Number of landcover classes:

3

Dominant landcover type:

210: water bodies

Fraction of dominant landcover type [%]:

75.0


Disturbances


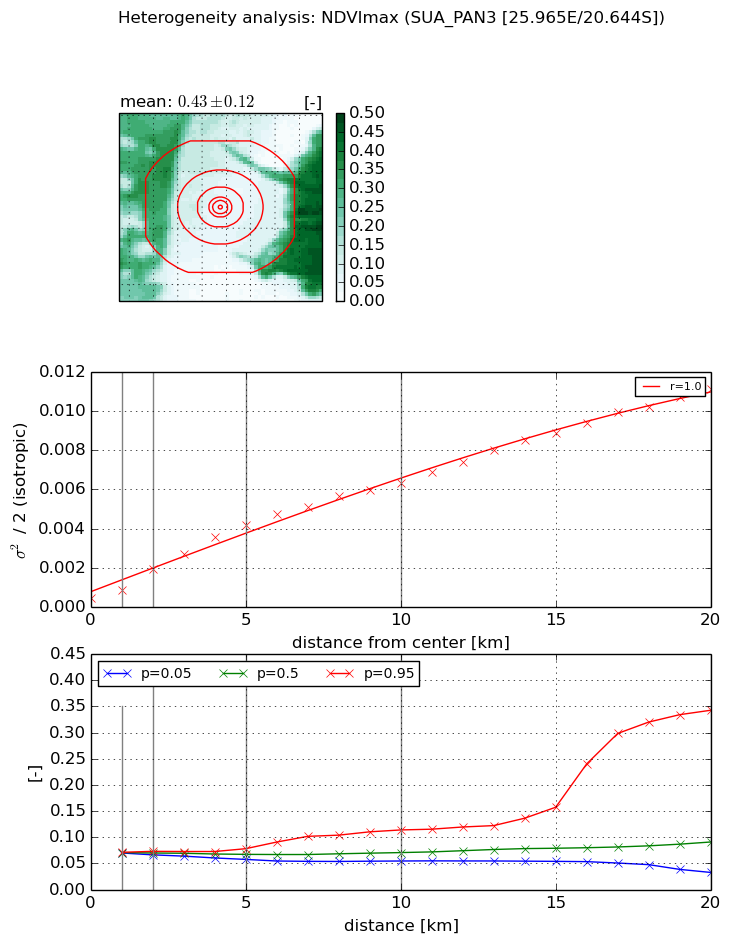
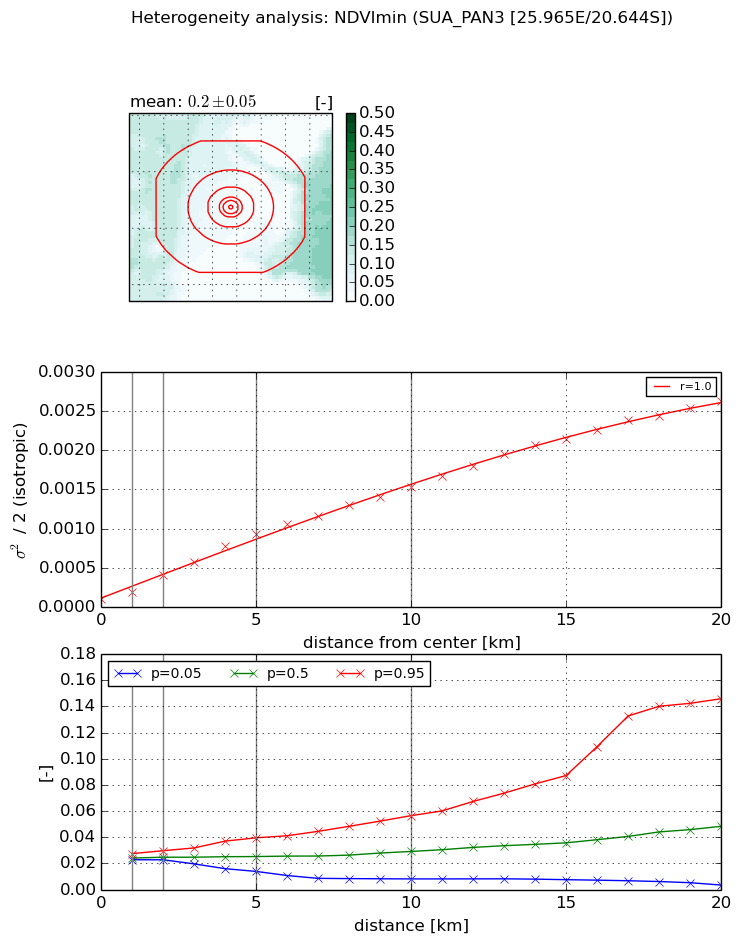
Heterogeneity analysis

The heterogeneity analysis provides information about the spatial and temporal heterogeneity of the site.

Topography


Roman et al. (2009) index


St

0.126797372658

Rcv

0.248911172258

Rse

0.0

Rst

0.266185681907

Rsv

23.144699379


Height range @ 1km [m]

8

Height range @ 2km [m]

9

Height range @ 5km [m]

12

Height range @ 10km [m]

-999

Height range @ 20km [m]

-999


Variance slope @ 1 km

9

Variance slope @ 2 km

3

Variance slope @ 5 km

0

Variance slope @ 10 km

-999

Variance slope @ 20 km

-999


NDVI (max. NDVI composite)


Roman et al. (2009) index


St

nan

Rcv

nan

Rse

nan

Rst

nan

Rsv

nan


NDVI range @ 1km [-]

0.0

NDVI range @ 2km [-]

0.01

NDVI range @ 5km [-]

0.02

NDVI range @ 10km [-]

0.06

NDVI range @ 20km [-]

0.31


Variance slope @ 1 km

0.000450095894865

Variance slope @ 2 km

0.000744652951581

Variance slope @ 5 km

0.000791443637815

Variance slope @ 10 km

0.000607482791848

Variance slope @ 20 km

0.000517416345068


NDVI (min. NDVI composite)I


Roman et al. (2009) index


St

0.964796067755

Rcv

1.1748666327

Rse

0.0

Rst

-0.934599031929

Rsv

-0.999999744973


NDVI range @ 1km [-]

0.0

NDVI range @ 2km [-]

0.01

NDVI range @ 5km [-]

0.03

NDVI range @ 10km [-]

0.05

NDVI range @ 20km [-]

0.14


NDVI slope @ 1 km

9.29687503467e-05

NDVI slope @ 2 km

0.00015483560786

NDVI slope @ 5 km

0.000174793133256

NDVI slope @ 10 km

0.000146898051755

NDVI slope @ 20 km

0.000126999167368


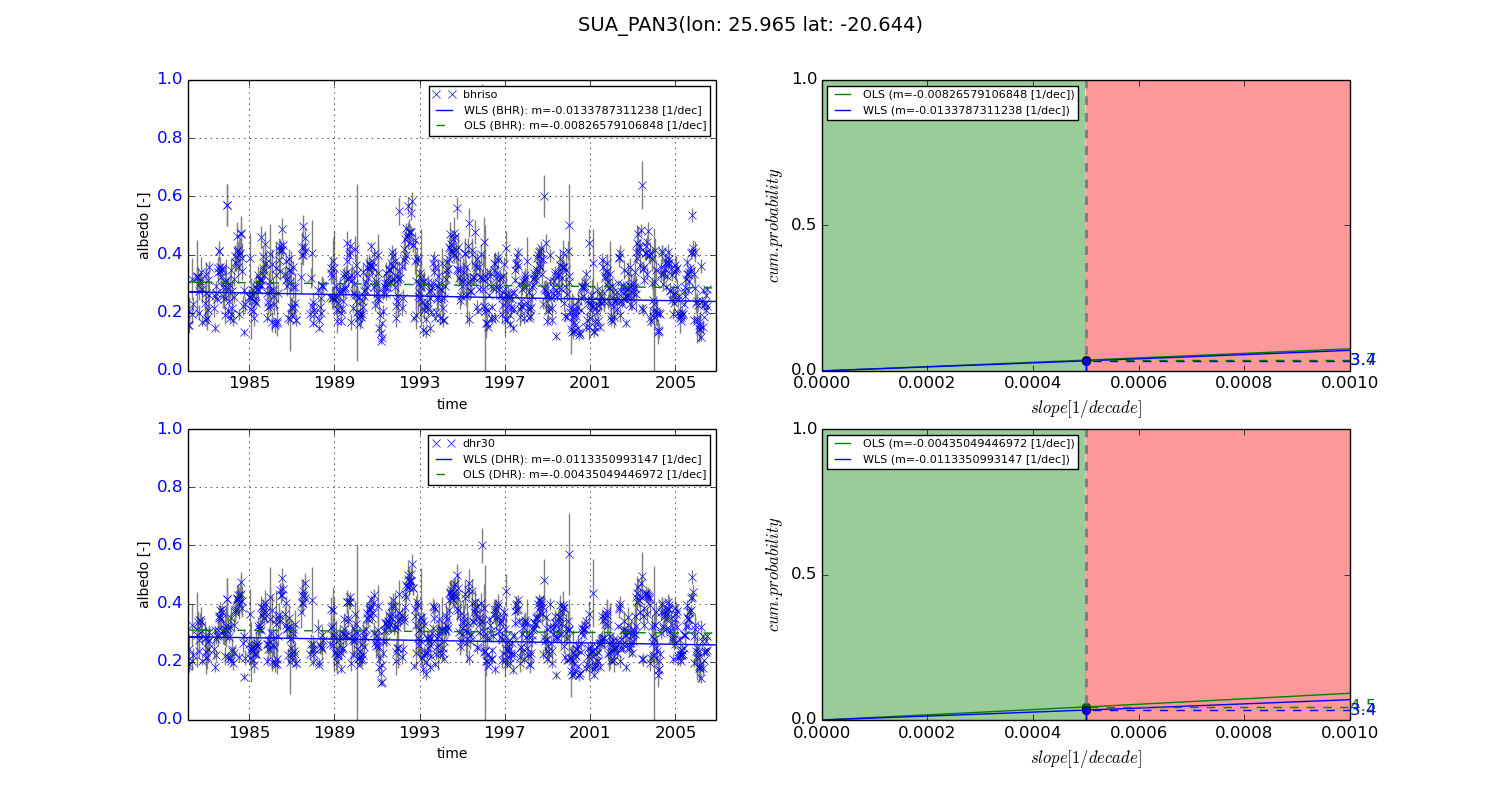
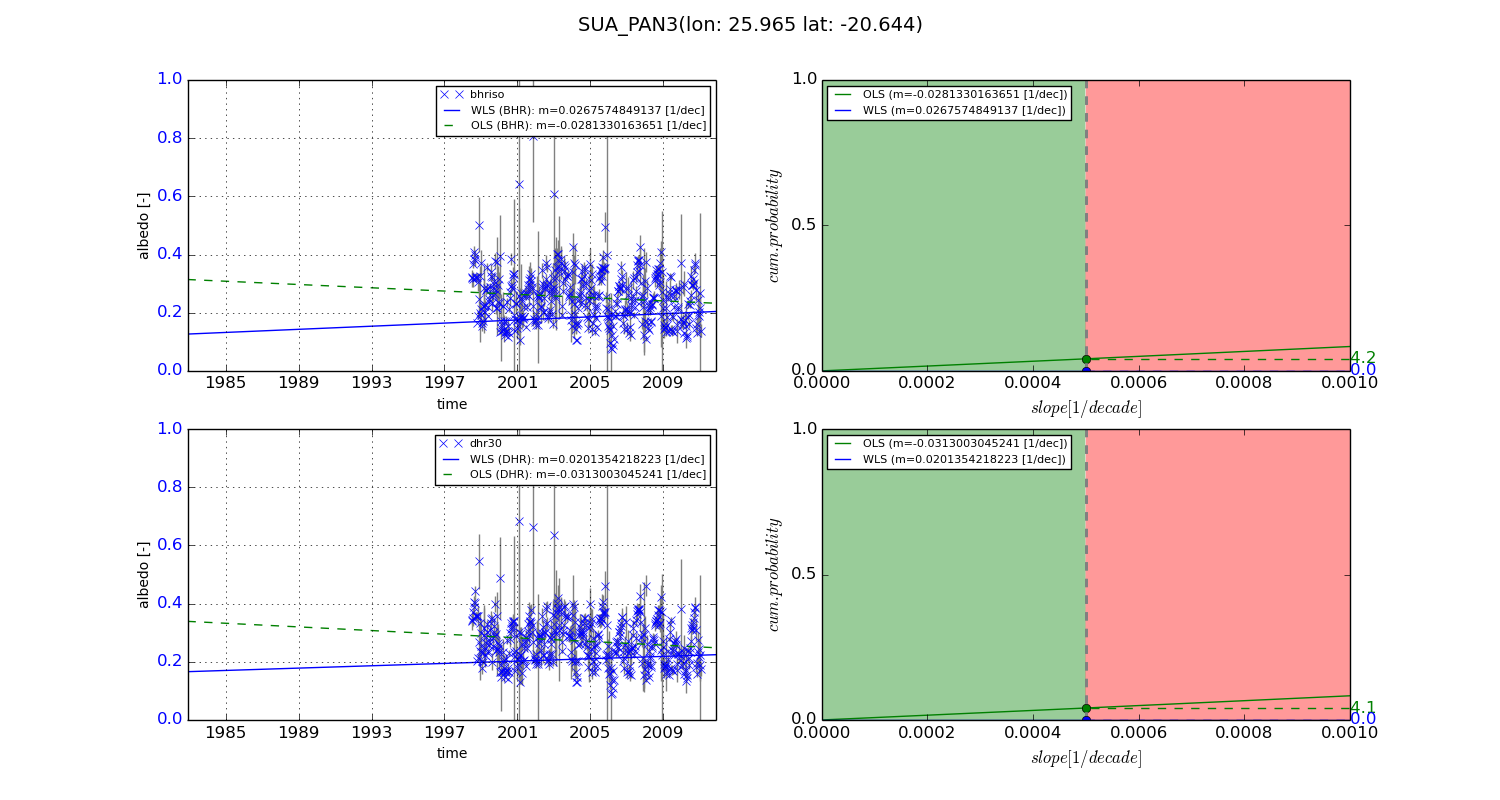
Temporal stability analysis

+000 deg (BHR)


BHR statistics

Temporal stability [1/decade]:


abs

rel


Weighted least square:

-0.0133787311238


Ordinary least square:

-0.00826579106848


Probabilities that GCOS criteria is met:

Weighted least square:

3.4 %

Ordinary least square:

3.7 %


DHR statistics

Temporal stability [1/decade]:


abs

rel


Weighted least square:

-0.0113350993147


Ordinary least square:

-0.00435049446972


Probabilities that GCOS criteria is met:

Weighted least square:

3.4 %

Ordinary least square:

4.5 %


+057/+063 deg (BHR)


BHR statistics

Temporal stability [1/decade]:


abs

rel


Weighted least square:

0.0267574849137


Ordinary least square:

-0.0281330163651


Probabilities that GCOS criteria is met:

Weighted least square:

0.0 %

Ordinary least square:

4.2 %


DHR statistics

Temporal stability [1/decade]:


abs

rel


Weighted least square:

0.0201354218223


Ordinary least square:

-0.0313003045241


Probabilities that GCOS criteria is met:

Weighted least square:

0.0 %

Ordinary least square:

4.1 %


Temporal anomaly analyis

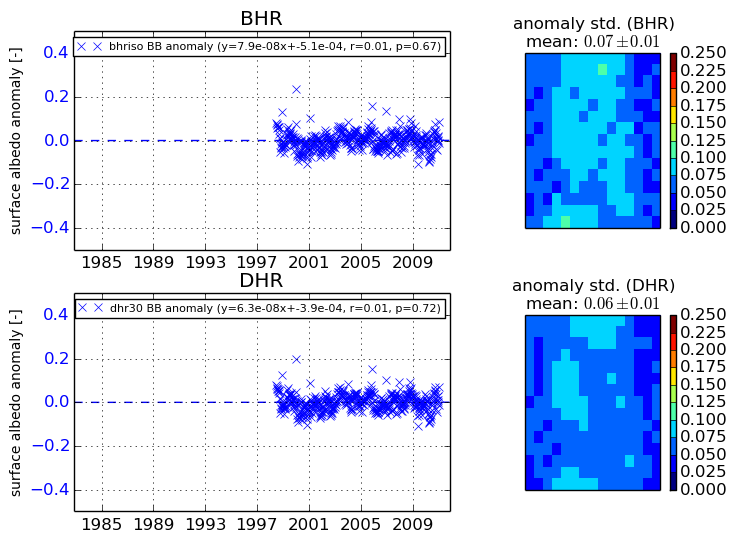
The variance of the temporal anomalies provides an additional measure about the stability of the signal AFTER removal of the mean seasonal cylce.
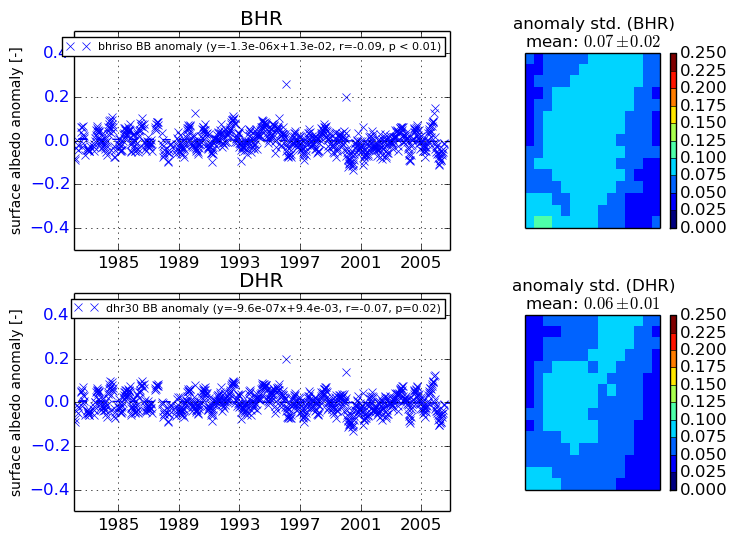
+000 deg


+057/+063 deg