SUA_PAN


Location

lon / lat [deg]: 26.0667 / -20.5333

Source network: AERONET


Geostationary surface albedo (GSA) data


“+000”


“+057/+063”


Landcover information (based on ESA CCI landcover data)


Landcover fractions @ 2km distance


Landcover fractions @ 20 km distance


Legend


Distance to open water bodies [km]:

0.79

Distance to urban areas [km]:

none in region


Radius: 1 km

Number of landcover classes:

3

Dominant landcover type:

130: grassland

Fraction of dominant landcover type [%]:

84.0


Radius: 2 km

Number of landcover classes:

4

Dominant landcover type:

130: grassland

Fraction of dominant landcover type [%]:

49.0


Radius: 5 km

Number of landcover classes:

4

Dominant landcover type:

210: water bodies

Fraction of dominant landcover type [%]:

70.0


Radius: 10 km

Number of landcover classes:

3

Dominant landcover type:

210: water bodies

Fraction of dominant landcover type [%]:

77.0


Radius: 20 km

Number of landcover classes:

4

Dominant landcover type:

210: water bodies

Fraction of dominant landcover type [%]:

72.0


Disturbances


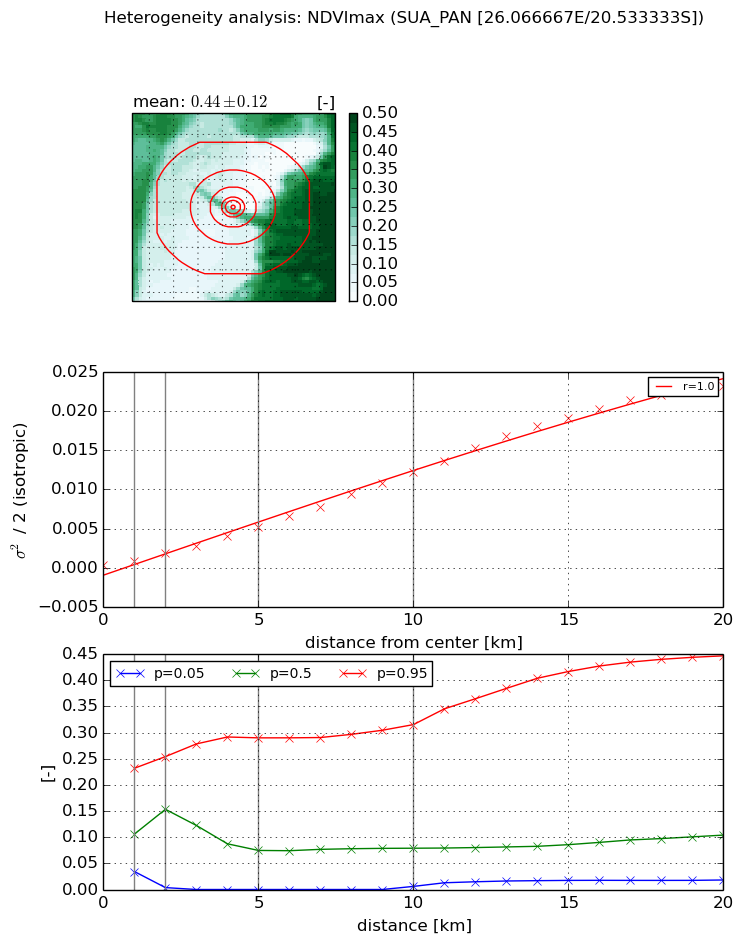
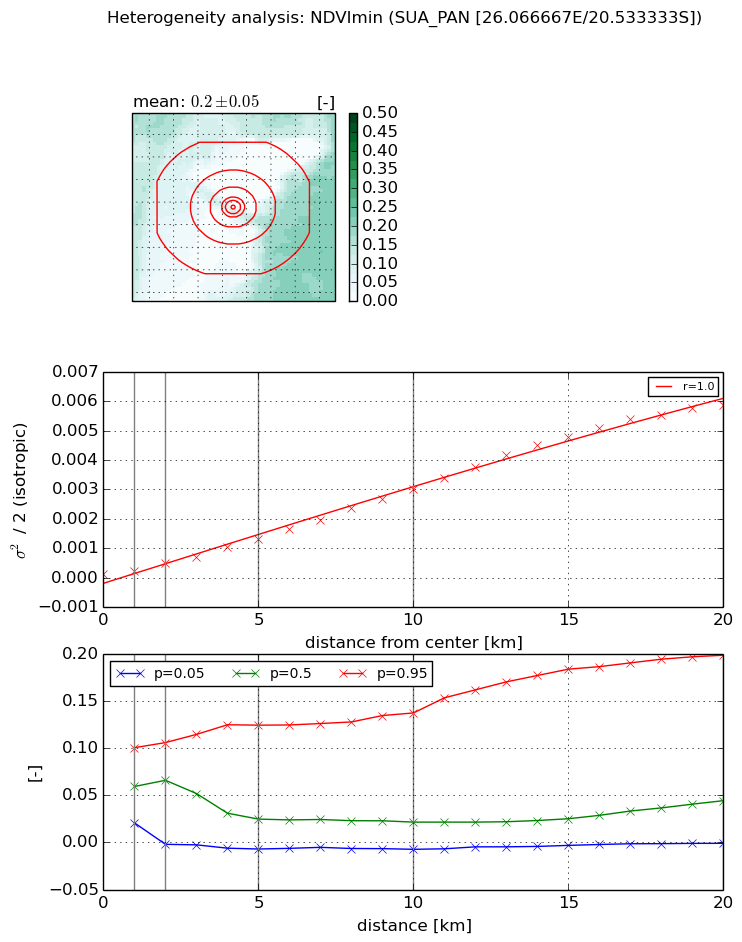
Heterogeneity analysis

The heterogeneity analysis provides information about the spatial and temporal heterogeneity of the site.

Topography


Roman et al. (2009) index


St

1.11588551022

Rcv

-0.175406682103

Rse

0.0

Rst

-0.294132980077

Rsv

2.2189081871


Height range @ 1km [m]

4

Height range @ 2km [m]

8

Height range @ 5km [m]

8

Height range @ 10km [m]

-999

Height range @ 20km [m]

-999


Variance slope @ 1 km

3

Variance slope @ 2 km

1

Variance slope @ 5 km

0

Variance slope @ 10 km

-999

Variance slope @ 20 km

-999


NDVI (max. NDVI composite)


Roman et al. (2009) index


St

19.7528661216

Rcv

0.128185560499

Rse

0.0

Rst

-0.0203713494538

Rsv

-0.00331978386574


NDVI range @ 1km [-]

0.2

NDVI range @ 2km [-]

0.25

NDVI range @ 5km [-]

0.29

NDVI range @ 10km [-]

0.31

NDVI range @ 20km [-]

0.43


Variance slope @ 1 km

0.000431302868775

Variance slope @ 2 km

0.000711776919504

Variance slope @ 5 km

0.000982629977294

Variance slope @ 10 km

0.00121676887854

Variance slope @ 20 km

0.00126257004676


NDVI (min. NDVI composite)I


Roman et al. (2009) index


St

6.56398031066

Rcv

0.253743528512

Rse

0.0

Rst

-0.0317268486424

Rsv

0.171569385004


NDVI range @ 1km [-]

0.08

NDVI range @ 2km [-]

0.11

NDVI range @ 5km [-]

0.13

NDVI range @ 10km [-]

0.14

NDVI range @ 20km [-]

0.2


NDVI slope @ 1 km

0.000111680262793

NDVI slope @ 2 km

0.000183525723709

NDVI slope @ 5 km

0.000247858988671

NDVI slope @ 10 km

0.000300602777758

NDVI slope @ 20 km

0.000316113144613


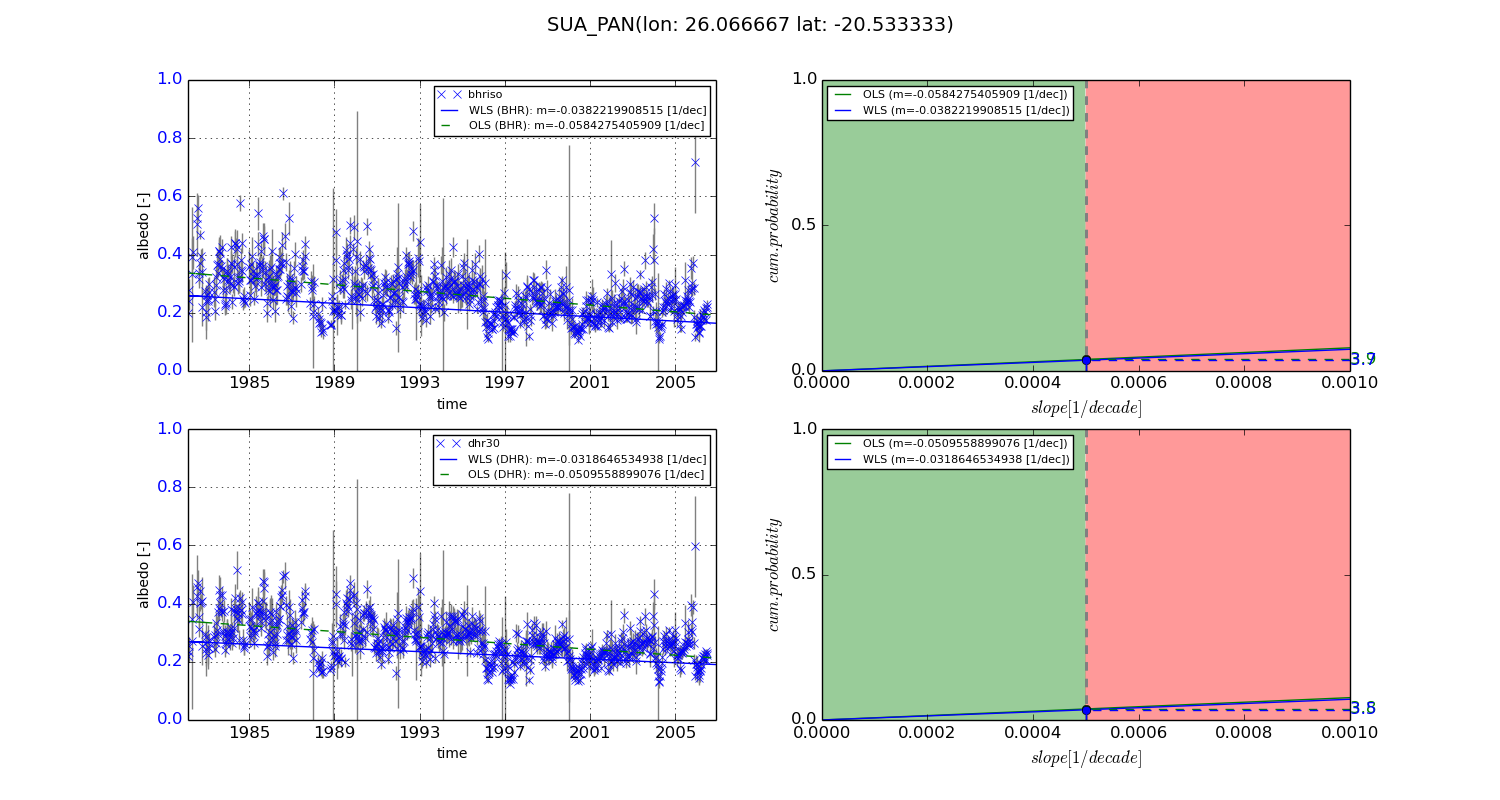
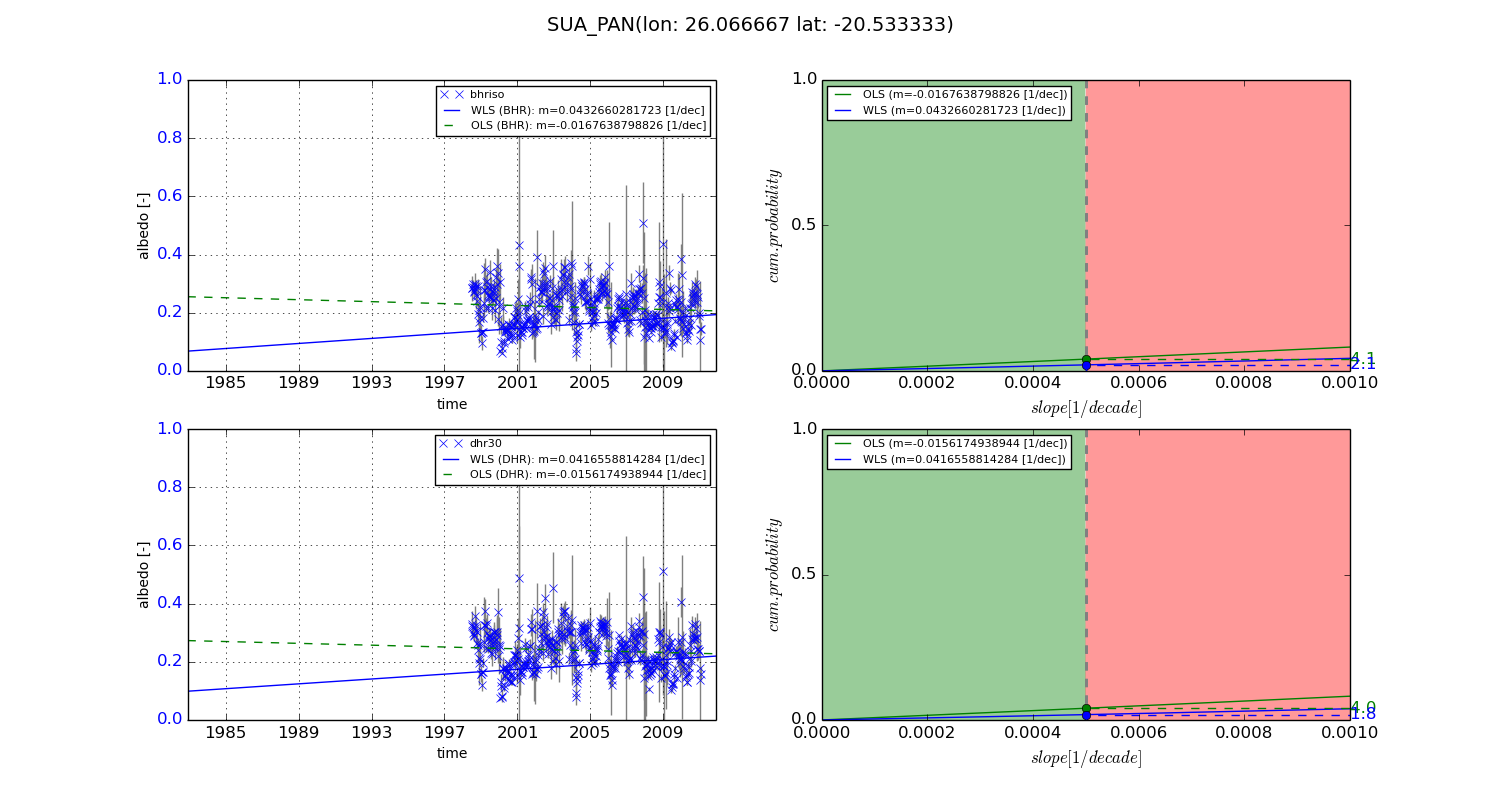
Temporal stability analysis

+000 deg (BHR)


BHR statistics

Temporal stability [1/decade]:


abs

rel


Weighted least square:

-0.0382219908515


Ordinary least square:

-0.0584275405909


Probabilities that GCOS criteria is met:

Weighted least square:

3.7 %

Ordinary least square:

3.9 %


DHR statistics

Temporal stability [1/decade]:


abs

rel


Weighted least square:

-0.0318646534938


Ordinary least square:

-0.0509558899076


Probabilities that GCOS criteria is met:

Weighted least square:

3.5 %

Ordinary least square:

3.8 %


+057/+063 deg (BHR)


BHR statistics

Temporal stability [1/decade]:


abs

rel


Weighted least square:

0.0432660281723


Ordinary least square:

-0.0167638798826


Probabilities that GCOS criteria is met:

Weighted least square:

2.1 %

Ordinary least square:

4.1 %


DHR statistics

Temporal stability [1/decade]:


abs

rel


Weighted least square:

0.0416558814284


Ordinary least square:

-0.0156174938944


Probabilities that GCOS criteria is met:

Weighted least square:

1.8 %

Ordinary least square:

4.0 %


Temporal anomaly analyis

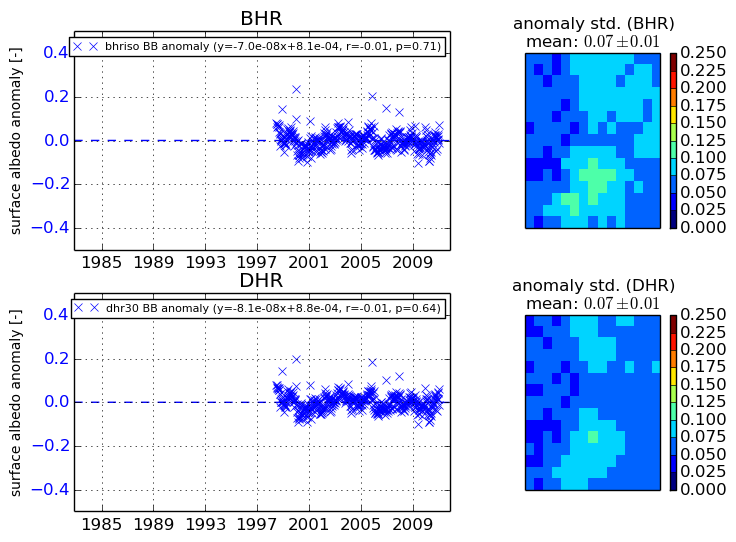
The variance of the temporal anomalies provides an additional measure about the stability of the signal AFTER removal of the mean seasonal cylce.
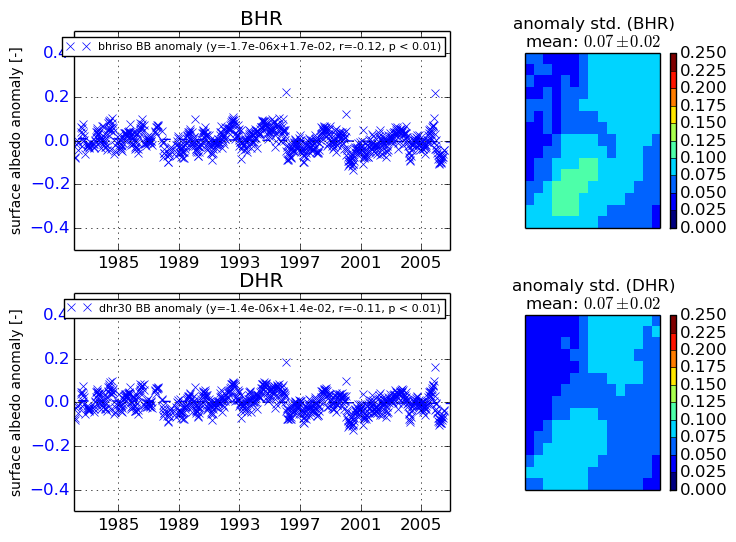
+000 deg


+057/+063 deg