T0_MAX_MEX


Location

lon / lat [deg]: -99.1485 / 19.4899

Source network: AERONET


Geostationary surface albedo (GSA) data


“+000”


“+057/+063”


Landcover information (based on ESA CCI landcover data)


Landcover fractions @ 2km distance


Landcover fractions @ 20 km distance


Legend


Distance to open water bodies [km]:

5.88

Distance to urban areas [km]:

0.04


Radius: 1 km

Number of landcover classes:

1

Dominant landcover type:

190: urban areas

Fraction of dominant landcover type [%]:

100.0


Radius: 2 km

Number of landcover classes:

1

Dominant landcover type:

190: urban areas

Fraction of dominant landcover type [%]:

100.0


Radius: 5 km

Number of landcover classes:

1

Dominant landcover type:

190: urban areas

Fraction of dominant landcover type [%]:

100.0


Radius: 10 km

Number of landcover classes:

2

Dominant landcover type:

190: urban areas

Fraction of dominant landcover type [%]:

96.0


Radius: 20 km

Number of landcover classes:

6

Dominant landcover type:

190: urban areas

Fraction of dominant landcover type [%]:

75.0


Disturbances


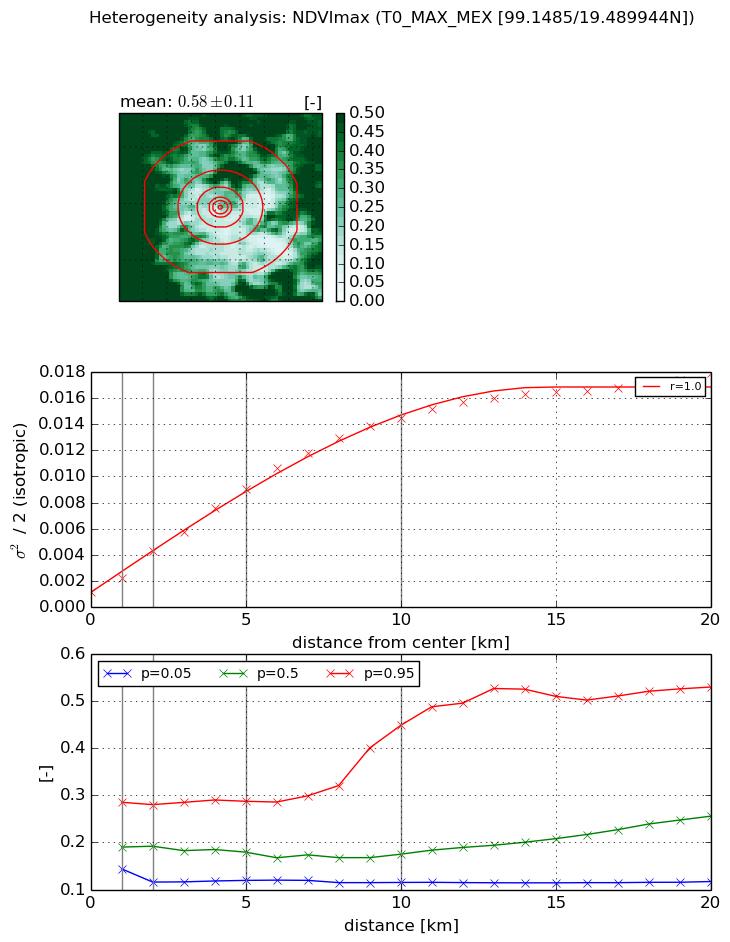
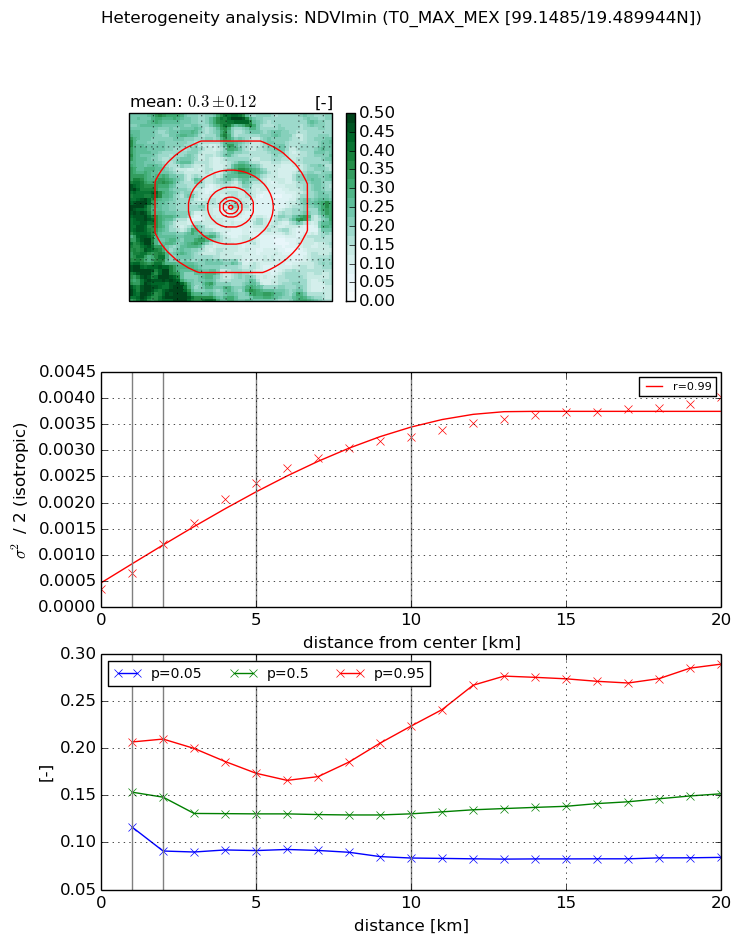
Heterogeneity analysis

The heterogeneity analysis provides information about the spatial and temporal heterogeneity of the site.

Topography


Roman et al. (2009) index


St

0.229328292916

Rcv

12.5808833414

Rse

0.0

Rst

-0.267731685163

Rsv

-0.233067838949


Height range @ 1km [m]

6

Height range @ 2km [m]

8

Height range @ 5km [m]

71

Height range @ 10km [m]

-999

Height range @ 20km [m]

-999


Variance slope @ 1 km

1328

Variance slope @ 2 km

865

Variance slope @ 5 km

262

Variance slope @ 10 km

-999

Variance slope @ 20 km

-999


NDVI (max. NDVI composite)


Roman et al. (2009) index


St

2.50582831316

Rcv

0.0338336552955

Rse

0.0

Rst

-0.211816901549

Rsv

0.95155835976


NDVI range @ 1km [-]

0.14

NDVI range @ 2km [-]

0.16

NDVI range @ 5km [-]

0.17

NDVI range @ 10km [-]

0.33

NDVI range @ 20km [-]

0.41


Variance slope @ 1 km

0.0010710553101

Variance slope @ 2 km

0.00154502116925

Variance slope @ 5 km

0.00162461731155

Variance slope @ 10 km

0.00140209388866

Variance slope @ 20 km

0.000799931776534


NDVI (min. NDVI composite)I


Roman et al. (2009) index


St

10.0685284023

Rcv

-0.186472945879

Rse

0.0

Rst

-0.0571870382306

Rsv

0.0542981563588


NDVI range @ 1km [-]

0.09

NDVI range @ 2km [-]

0.12

NDVI range @ 5km [-]

0.08

NDVI range @ 10km [-]

0.14

NDVI range @ 20km [-]

0.21


NDVI slope @ 1 km

0.000308624990439

NDVI slope @ 2 km

0.000431804009225

NDVI slope @ 5 km

0.000422619520862

NDVI slope @ 10 km

0.000302406535746

NDVI slope @ 20 km

0.000163681342353


Temporal stability analysis

+000 deg (BHR)


BHR statistics

Temporal stability [1/decade]:


abs

rel


Weighted least square:

None


Ordinary least square:

None


Probabilities that GCOS criteria is met:

Weighted least square:

None %

Ordinary least square:

None %


DHR statistics

Temporal stability [1/decade]:


abs

rel


Weighted least square:

None


Ordinary least square:

None


Probabilities that GCOS criteria is met:

Weighted least square:

None %

Ordinary least square:

None %


+057/+063 deg (BHR)


BHR statistics

Temporal stability [1/decade]:


abs

rel


Weighted least square:

None


Ordinary least square:

None


Probabilities that GCOS criteria is met:

Weighted least square:

None %

Ordinary least square:

None %


DHR statistics

Temporal stability [1/decade]:


abs

rel


Weighted least square:

None


Ordinary least square:

None


Probabilities that GCOS criteria is met:

Weighted least square:

None %

Ordinary least square:

None %


Temporal anomaly analyis

The variance of the temporal anomalies provides an additional measure about the stability of the signal AFTER removal of the mean seasonal cylce.

+000 deg


+057/+063 deg