TABLE_MOUNTAIN_CA


Location

lon / lat [deg]: -117.68 / 34.38

Source network: AERONET


Geostationary surface albedo (GSA) data


“+000”


“+057/+063”


Landcover information (based on ESA CCI landcover data)


Landcover fractions @ 2km distance


Landcover fractions @ 20 km distance


Legend


Distance to open water bodies [km]:

8.14

Distance to urban areas [km]:

0.28


Radius: 1 km

Number of landcover classes:

2

Dominant landcover type:

70: Tree cover, needleleaved, evergreen, closed to open (>15%)

Fraction of dominant landcover type [%]:

95.0


Radius: 2 km

Number of landcover classes:

2

Dominant landcover type:

70: Tree cover, needleleaved, evergreen, closed to open (>15%)

Fraction of dominant landcover type [%]:

85.0


Radius: 5 km

Number of landcover classes:

4

Dominant landcover type:

70: Tree cover, needleleaved, evergreen, closed to open (>15%)

Fraction of dominant landcover type [%]:

70.0


Radius: 10 km

Number of landcover classes:

5

Dominant landcover type:

70: Tree cover, needleleaved, evergreen, closed to open (>15%)

Fraction of dominant landcover type [%]:

53.0


Radius: 20 km

Number of landcover classes:

5

Dominant landcover type:

70: Tree cover, needleleaved, evergreen, closed to open (>15%)

Fraction of dominant landcover type [%]:

43.0


Disturbances


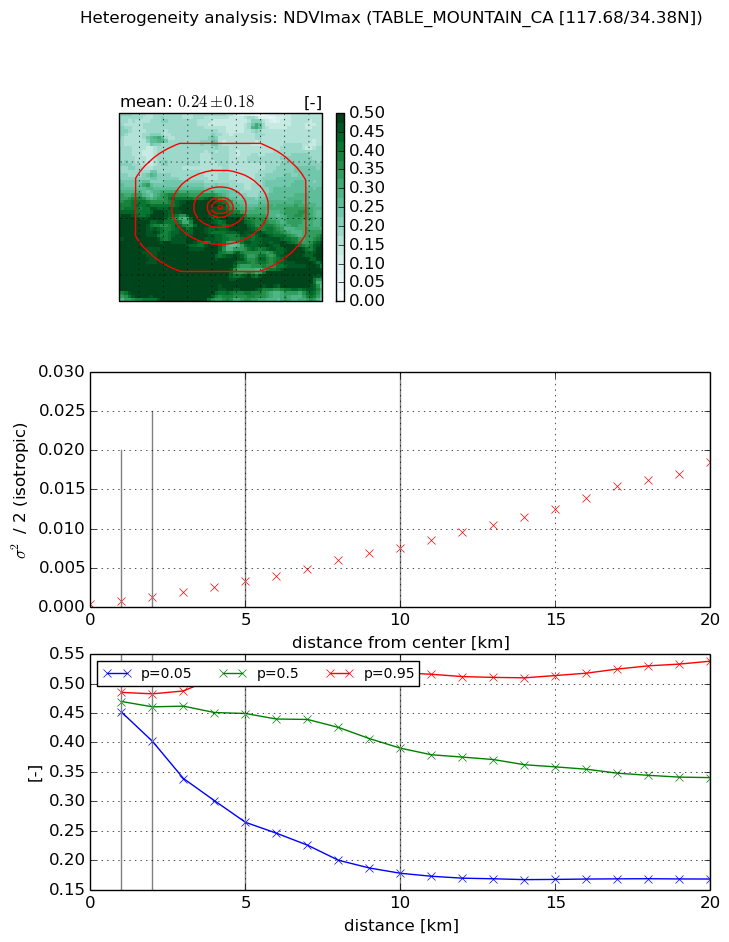
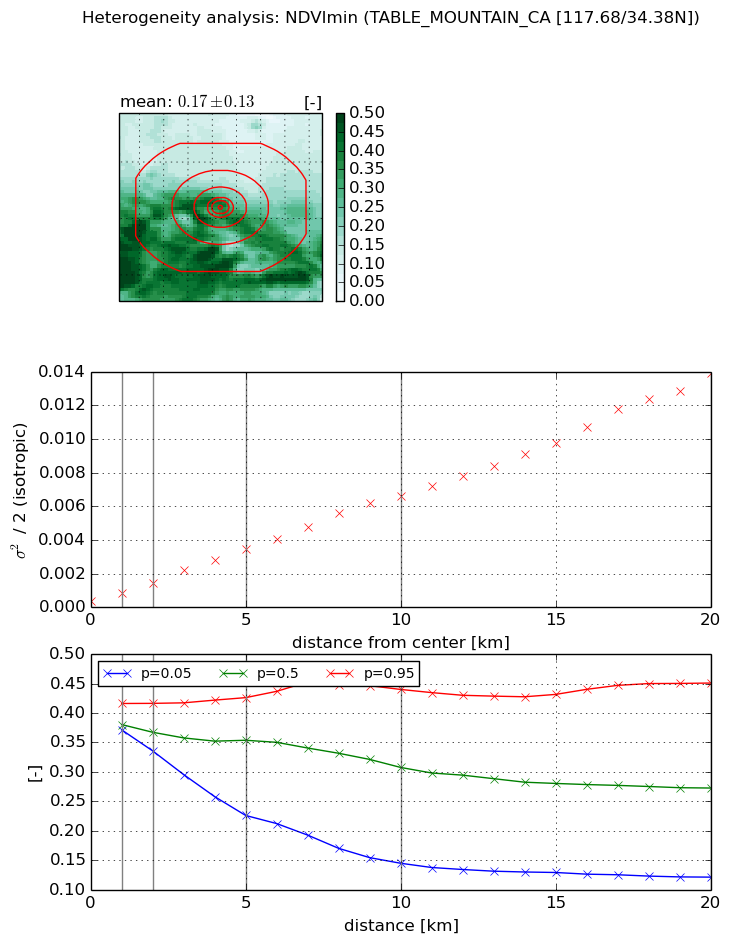
Heterogeneity analysis

The heterogeneity analysis provides information about the spatial and temporal heterogeneity of the site.

Topography


Roman et al. (2009) index


St

3.68653219163e-06

Rcv

0.635438109558

Rse

0.0

Rst

0.026660715122

Rsv

813772.239929


Height range @ 1km [m]

237

Height range @ 2km [m]

399

Height range @ 5km [m]

886

Height range @ 10km [m]

-999

Height range @ 20km [m]

-999


Variance slope @ 1 km

14950

Variance slope @ 2 km

18873

Variance slope @ 5 km

18166

Variance slope @ 10 km

-999

Variance slope @ 20 km

-999


NDVI (max. NDVI composite)


Roman et al. (2009) index


St

3.473791436

Rcv

0.813866117957

Rse

0.0

Rst

-1.0143516909e-08

Rsv

-0.0497435776835


NDVI range @ 1km [-]

0.03

NDVI range @ 2km [-]

0.08

NDVI range @ 5km [-]

0.25

NDVI range @ 10km [-]

0.34

NDVI range @ 20km [-]

0.37


Variance slope @ 1 km

0.000401061675781

Variance slope @ 2 km

0.000462855583262

Variance slope @ 5 km

0.000604950171091

Variance slope @ 10 km

0.000749088484125

Variance slope @ 20 km

0.000923690664026


NDVI (min. NDVI composite)I


Roman et al. (2009) index


St

1.48472072904

Rcv

0.671956282465

Rse

0.0

Rst

-0.348626099361

Rsv

-0.999999631559


NDVI range @ 1km [-]

0.04

NDVI range @ 2km [-]

0.08

NDVI range @ 5km [-]

0.2

NDVI range @ 10km [-]

0.3

NDVI range @ 20km [-]

0.33


NDVI slope @ 1 km

0.000464860449299

NDVI slope @ 2 km

0.000528010521512

NDVI slope @ 5 km

0.000629801470763

NDVI slope @ 10 km

0.000649385105897

NDVI slope @ 20 km

0.0006688176501


Temporal stability analysis

+000 deg (BHR)


BHR statistics

Temporal stability [1/decade]:


abs

rel


Weighted least square:

None


Ordinary least square:

None


Probabilities that GCOS criteria is met:

Weighted least square:

None %

Ordinary least square:

None %


DHR statistics

Temporal stability [1/decade]:


abs

rel


Weighted least square:

None


Ordinary least square:

None


Probabilities that GCOS criteria is met:

Weighted least square:

None %

Ordinary least square:

None %


+057/+063 deg (BHR)


BHR statistics

Temporal stability [1/decade]:


abs

rel


Weighted least square:

None


Ordinary least square:

None


Probabilities that GCOS criteria is met:

Weighted least square:

None %

Ordinary least square:

None %


DHR statistics

Temporal stability [1/decade]:


abs

rel


Weighted least square:

None


Ordinary least square:

None


Probabilities that GCOS criteria is met:

Weighted least square:

None %

Ordinary least square:

None %


Temporal anomaly analyis

The variance of the temporal anomalies provides an additional measure about the stability of the signal AFTER removal of the mean seasonal cylce.

+000 deg


+057/+063 deg


By continuing to use this website, you are giving consent to analytic cookies being used. For more information on how EUMETSAT uses data and how you can disable this, please view this web page: Analytics Cookie Policy