TAHOE_CITY


Location

lon / lat [deg]: -120.135 / 39.1733

Source network: AERONET


Geostationary surface albedo (GSA) data


“+000”


“+057/+063”


Landcover information (based on ESA CCI landcover data)


Landcover fractions @ 2km distance


Landcover fractions @ 20 km distance


Legend


Distance to open water bodies [km]:

0.04

Distance to urban areas [km]:

0.22


Radius: 1 km

Number of landcover classes:

3

Dominant landcover type:

210: water bodies

Fraction of dominant landcover type [%]:

71.0


Radius: 2 km

Number of landcover classes:

3

Dominant landcover type:

210: water bodies

Fraction of dominant landcover type [%]:

63.0


Radius: 5 km

Number of landcover classes:

3

Dominant landcover type:

210: water bodies

Fraction of dominant landcover type [%]:

50.0


Radius: 10 km

Number of landcover classes:

4

Dominant landcover type:

210: water bodies

Fraction of dominant landcover type [%]:

49.0


Radius: 20 km

Number of landcover classes:

5

Dominant landcover type:

70: Tree cover, needleleaved, evergreen, closed to open (>15%)

Fraction of dominant landcover type [%]:

58.0


Disturbances


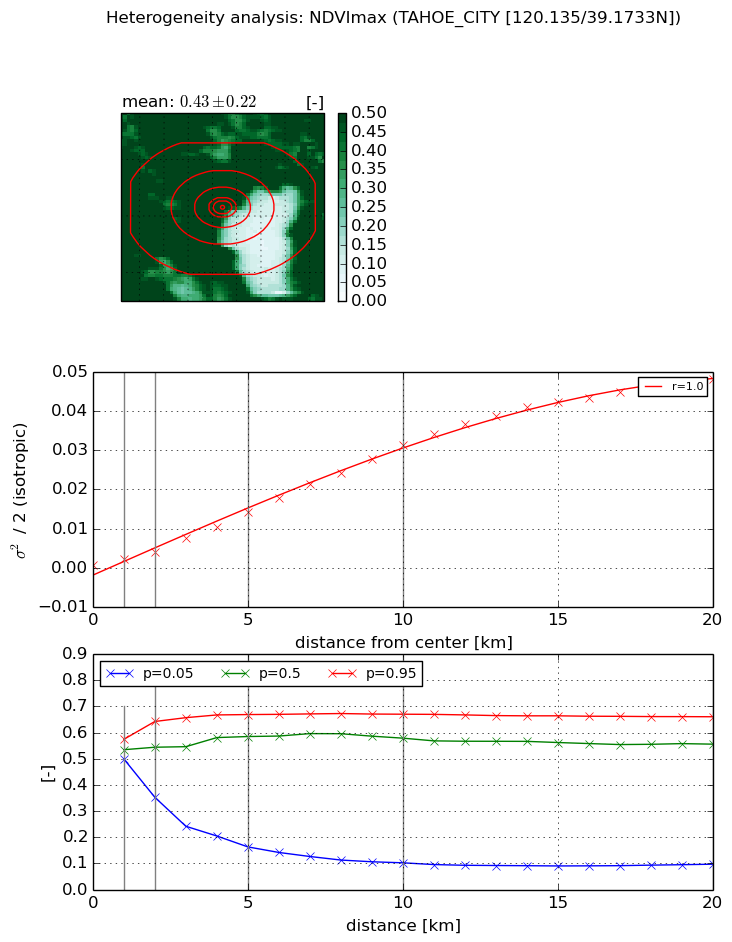
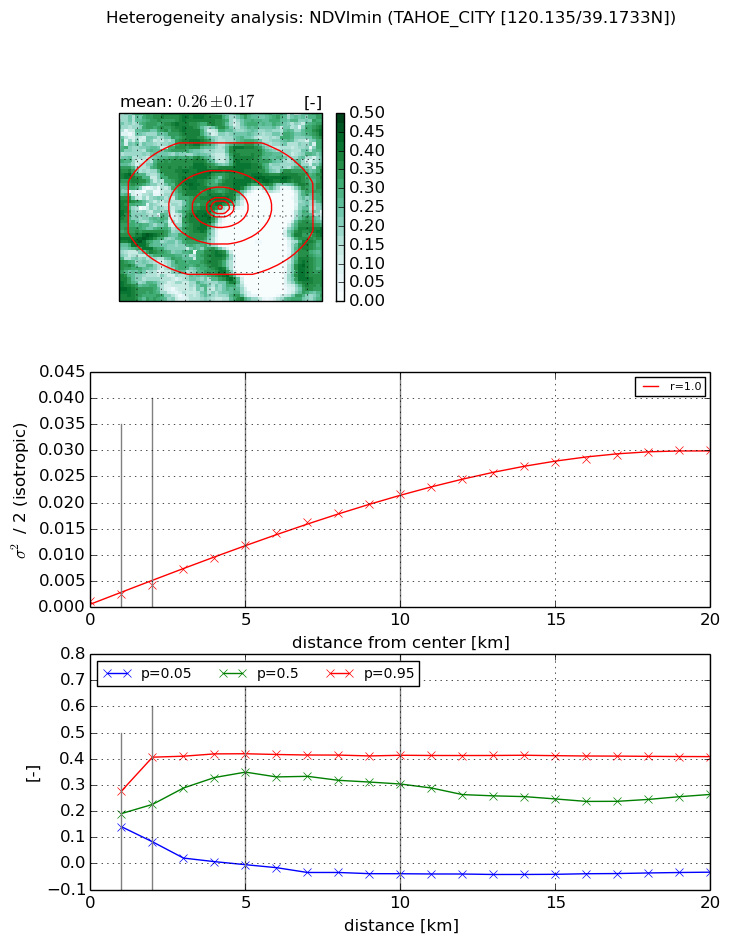
Heterogeneity analysis

The heterogeneity analysis provides information about the spatial and temporal heterogeneity of the site.

Topography


Roman et al. (2009) index


St

2.20780357079

Rcv

0.360888980217

Rse

0.0

Rst

-0.000150896929841

Rsv

-0.997776658751


Height range @ 1km [m]

95

Height range @ 2km [m]

172

Height range @ 5km [m]

349

Height range @ 10km [m]

-999

Height range @ 20km [m]

-999


Variance slope @ 1 km

3493

Variance slope @ 2 km

3671

Variance slope @ 5 km

3563

Variance slope @ 10 km

-999

Variance slope @ 20 km

-999


NDVI (max. NDVI composite)


Roman et al. (2009) index


St

6.2857597434e-06

Rcv

0.303735077192

Rse

0.0

Rst

0.130008541243

Rsv

477268.841963


NDVI range @ 1km [-]

0.08

NDVI range @ 2km [-]

0.29

NDVI range @ 5km [-]

0.51

NDVI range @ 10km [-]

0.57

NDVI range @ 20km [-]

0.56


Variance slope @ 1 km

0.00136671570589

Variance slope @ 2 km

0.00157525823771

Variance slope @ 5 km

0.00271657540762

Variance slope @ 10 km

0.00318839689449

Variance slope @ 20 km

0.00259055077172


NDVI (min. NDVI composite)I


Roman et al. (2009) index


St

3.37741599524

Rcv

0.131392216696

Rse

0.0

Rst

-0.0318513072179

Rsv

0.725009508651


NDVI range @ 1km [-]

0.14

NDVI range @ 2km [-]

0.32

NDVI range @ 5km [-]

0.42

NDVI range @ 10km [-]

0.45

NDVI range @ 20km [-]

0.44


NDVI slope @ 1 km

0.00131251678074

NDVI slope @ 2 km

0.00149618528346

NDVI slope @ 5 km

0.00221414126271

NDVI slope @ 10 km

0.00212669778711

NDVI slope @ 20 km

0.00153336213682


Temporal stability analysis

+000 deg (BHR)


BHR statistics

Temporal stability [1/decade]:


abs

rel


Weighted least square:

None


Ordinary least square:

None


Probabilities that GCOS criteria is met:

Weighted least square:

None %

Ordinary least square:

None %


DHR statistics

Temporal stability [1/decade]:


abs

rel


Weighted least square:

None


Ordinary least square:

None


Probabilities that GCOS criteria is met:

Weighted least square:

None %

Ordinary least square:

None %


+057/+063 deg (BHR)


BHR statistics

Temporal stability [1/decade]:


abs

rel


Weighted least square:

None


Ordinary least square:

None


Probabilities that GCOS criteria is met:

Weighted least square:

None %

Ordinary least square:

None %


DHR statistics

Temporal stability [1/decade]:


abs

rel


Weighted least square:

None


Ordinary least square:

None


Probabilities that GCOS criteria is met:

Weighted least square:

None %

Ordinary least square:

None %


Temporal anomaly analyis

The variance of the temporal anomalies provides an additional measure about the stability of the signal AFTER removal of the mean seasonal cylce.

+000 deg


+057/+063 deg