TAIHU


Location

lon / lat [deg]: 120.2153 / 31.421

Source network: AERONET


Geostationary surface albedo (GSA) data


“+000”


“+057/+063”


Landcover information (based on ESA CCI landcover data)


Landcover fractions @ 2km distance


Landcover fractions @ 20 km distance


Legend


Distance to open water bodies [km]:

0.02

Distance to urban areas [km]:

1.95


Radius: 1 km

Number of landcover classes:

4

Dominant landcover type:

210: water bodies

Fraction of dominant landcover type [%]:

54.0


Radius: 2 km

Number of landcover classes:

7

Dominant landcover type:

210: water bodies

Fraction of dominant landcover type [%]:

53.0


Radius: 5 km

Number of landcover classes:

5

Dominant landcover type:

210: water bodies

Fraction of dominant landcover type [%]:

71.0


Radius: 10 km

Number of landcover classes:

6

Dominant landcover type:

210: water bodies

Fraction of dominant landcover type [%]:

77.0


Radius: 20 km

Number of landcover classes:

9

Dominant landcover type:

210: water bodies

Fraction of dominant landcover type [%]:

64.0


Disturbances


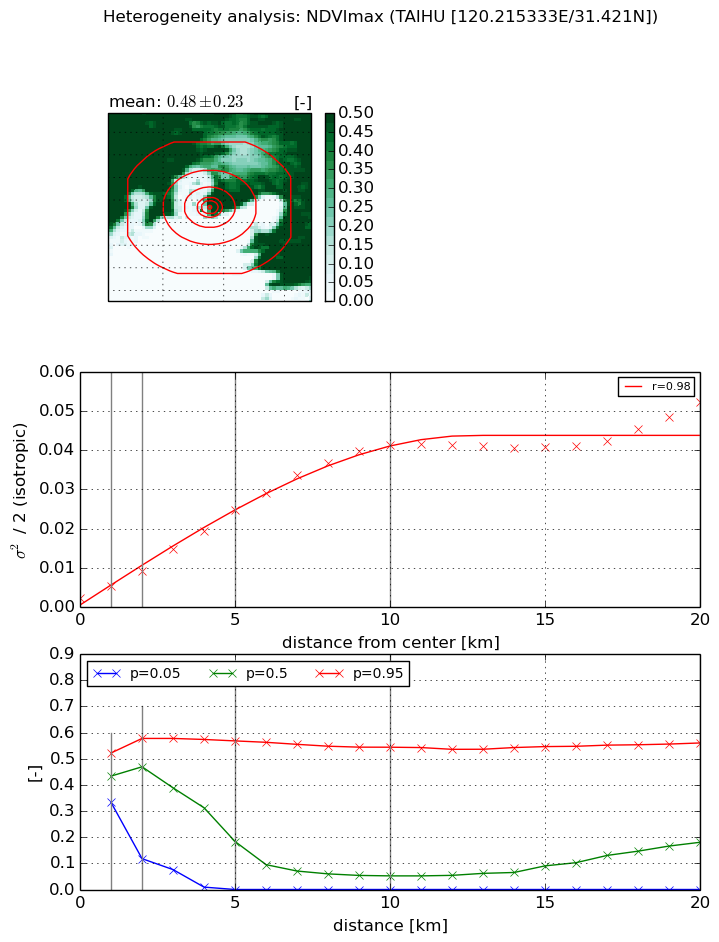
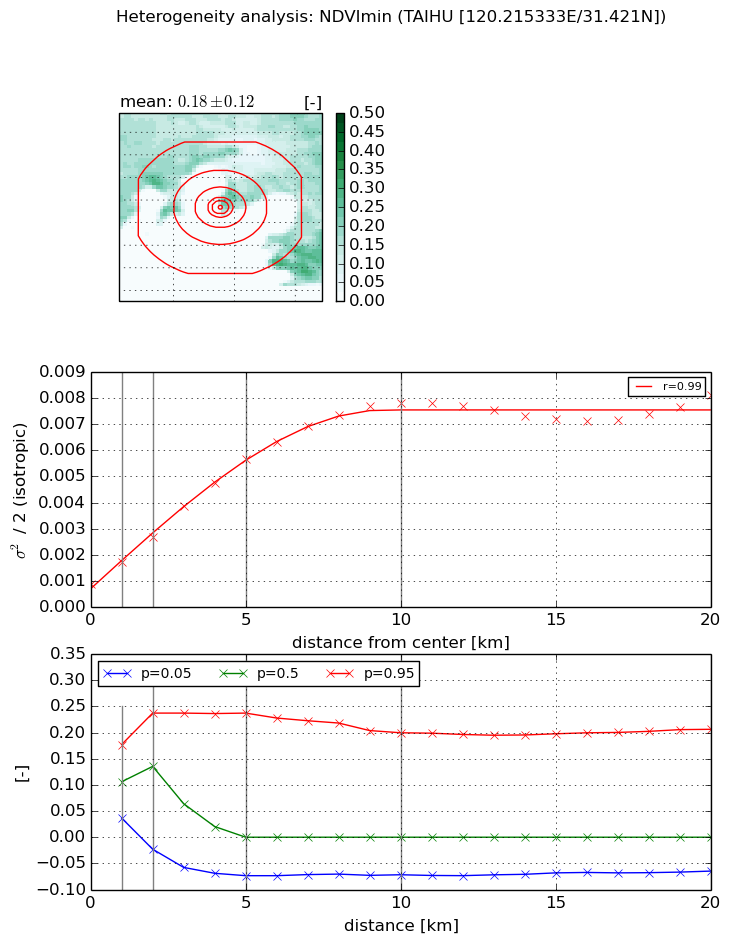
Heterogeneity analysis

The heterogeneity analysis provides information about the spatial and temporal heterogeneity of the site.

Topography


Roman et al. (2009) index


St

7.24732107885

Rcv

0.245798137884

Rse

0.0

Rst

-0.0447109246424

Rsv

-0.123436996625


Height range @ 1km [m]

29

Height range @ 2km [m]

39

Height range @ 5km [m]

47

Height range @ 10km [m]

-999

Height range @ 20km [m]

-999


Variance slope @ 1 km

229

Variance slope @ 2 km

152

Variance slope @ 5 km

71

Variance slope @ 10 km

-999

Variance slope @ 20 km

-999


NDVI (max. NDVI composite)


Roman et al. (2009) index


St

1.28824482759

Rcv

0.78681982928

Rse

0.0

Rst

0.0894586378804

Rsv

1.45247142242


NDVI range @ 1km [-]

0.19

NDVI range @ 2km [-]

0.46

NDVI range @ 5km [-]

0.57

NDVI range @ 10km [-]

0.54

NDVI range @ 20km [-]

0.56


Variance slope @ 1 km

0.00308284353161

Variance slope @ 2 km

0.00346991683535

Variance slope @ 5 km

0.00455915624968

Variance slope @ 10 km

0.00420533062228

Variance slope @ 20 km

0.00215372917199


NDVI (min. NDVI composite)I


Roman et al. (2009) index


St

4.11770906962

Rcv

0.575118302614

Rse

0.0

Rst

-0.0102942976112

Rsv

0.143147856397


NDVI range @ 1km [-]

0.14

NDVI range @ 2km [-]

0.26

NDVI range @ 5km [-]

0.31

NDVI range @ 10km [-]

0.27

NDVI range @ 20km [-]

0.27


NDVI slope @ 1 km

0.000842410756352

NDVI slope @ 2 km

0.000898390454799

NDVI slope @ 5 km

0.000976466998971

NDVI slope @ 10 km

0.000730477085662

NDVI slope @ 20 km

0.000279728923614


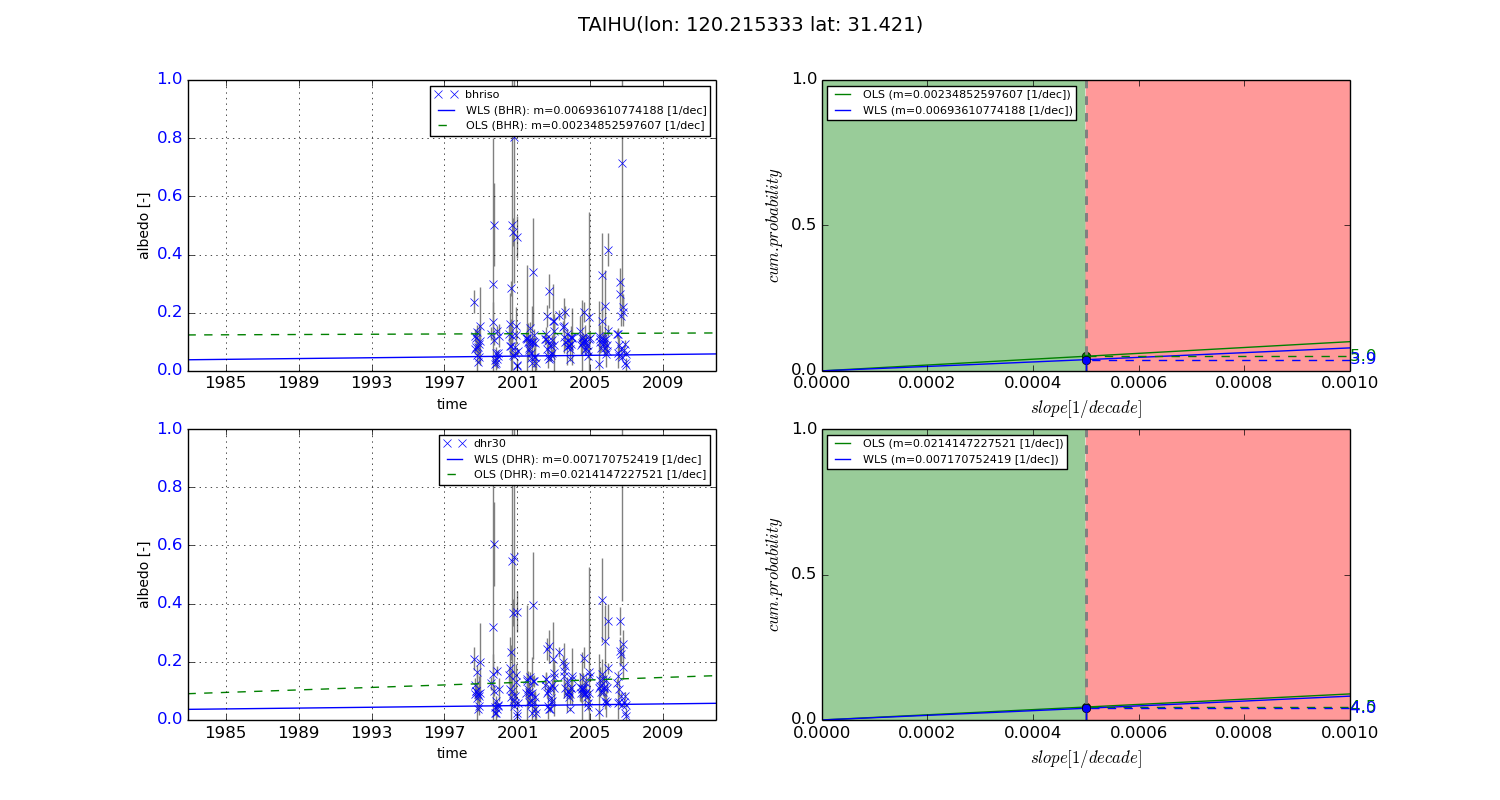
Temporal stability analysis

+000 deg (BHR)


BHR statistics

Temporal stability [1/decade]:


abs

rel


Weighted least square:

None


Ordinary least square:

None


Probabilities that GCOS criteria is met:

Weighted least square:

None %

Ordinary least square:

None %


DHR statistics

Temporal stability [1/decade]:


abs

rel


Weighted least square:

None


Ordinary least square:

None


Probabilities that GCOS criteria is met:

Weighted least square:

None %

Ordinary least square:

None %


+057/+063 deg (BHR)


BHR statistics

Temporal stability [1/decade]:


abs

rel


Weighted least square:

0.00693610774188


Ordinary least square:

0.00234852597607


Probabilities that GCOS criteria is met:

Weighted least square:

3.9 %

Ordinary least square:

5.0 %


DHR statistics

Temporal stability [1/decade]:


abs

rel


Weighted least square:

0.007170752419


Ordinary least square:

0.0214147227521


Probabilities that GCOS criteria is met:

Weighted least square:

4.0 %

Ordinary least square:

4.5 %


Temporal anomaly analyis

The variance of the temporal anomalies provides an additional measure about the stability of the signal AFTER removal of the mean seasonal cylce.

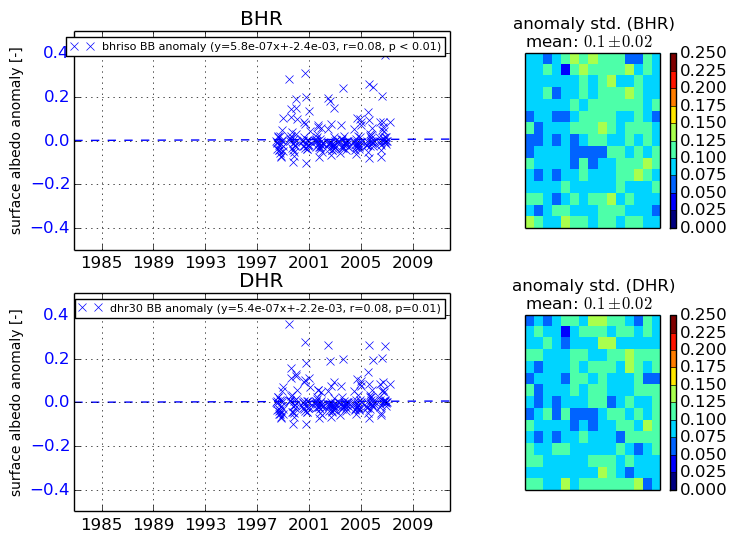
+000 deg


+057/+063 deg