TAMANRASSET_INM


Location

lon / lat [deg]: 5.53 / 22.79

Source network: AERONET


Geostationary surface albedo (GSA) data


“+000”


“+057/+063”


Landcover information (based on ESA CCI landcover data)


Landcover fractions @ 2km distance


Landcover fractions @ 20 km distance


Legend


Distance to open water bodies [km]:

none in region

Distance to urban areas [km]:

0.09


Radius: 1 km

Number of landcover classes:

1

Dominant landcover type:

190: urban areas

Fraction of dominant landcover type [%]:

100.0


Radius: 2 km

Number of landcover classes:

1

Dominant landcover type:

190: urban areas

Fraction of dominant landcover type [%]:

99.0


Radius: 5 km

Number of landcover classes:

2

Dominant landcover type:

200: bare areas

Fraction of dominant landcover type [%]:

60.0


Radius: 10 km

Number of landcover classes:

2

Dominant landcover type:

200: bare areas

Fraction of dominant landcover type [%]:

89.0


Radius: 20 km

Number of landcover classes:

2

Dominant landcover type:

200: bare areas

Fraction of dominant landcover type [%]:

97.0


Disturbances


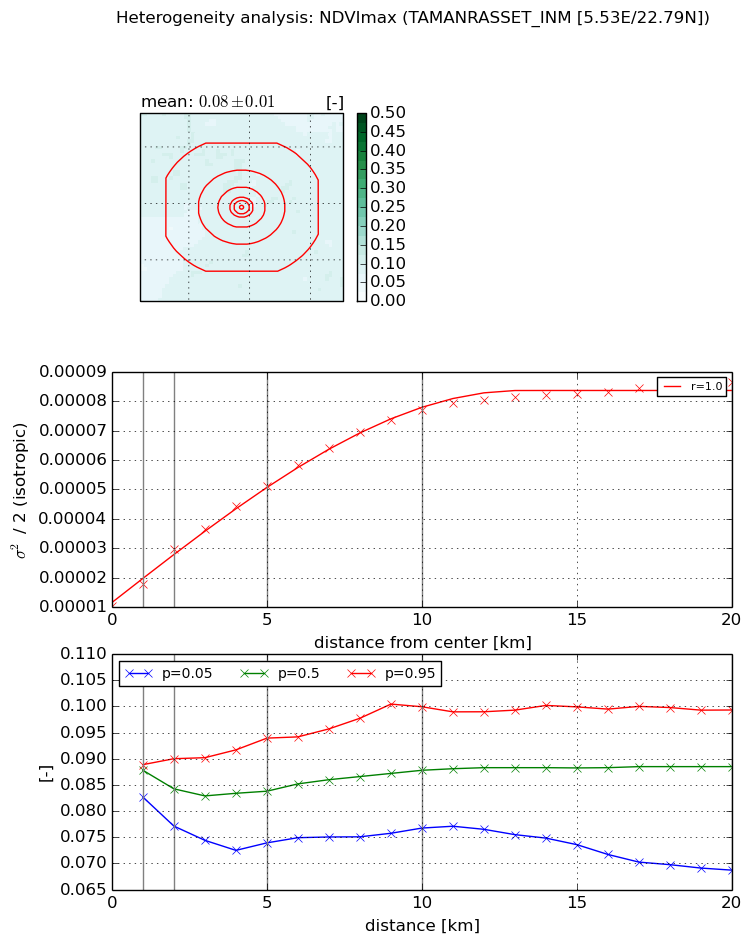
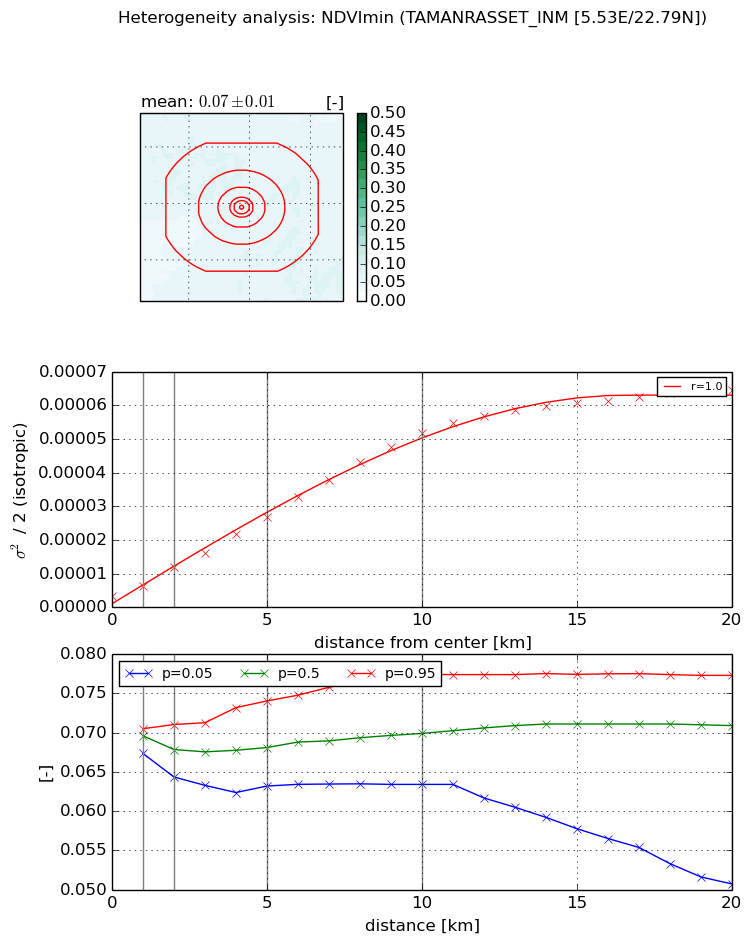
Heterogeneity analysis

The heterogeneity analysis provides information about the spatial and temporal heterogeneity of the site.

Topography


Roman et al. (2009) index


St

0.233313413638

Rcv

0.985262651728

Rse

0.0

Rst

-1.91077386011e-05

Rsv

11.8729588072


Height range @ 1km [m]

19

Height range @ 2km [m]

25

Height range @ 5km [m]

61

Height range @ 10km [m]

-999

Height range @ 20km [m]

-999


Variance slope @ 1 km

321

Variance slope @ 2 km

219

Variance slope @ 5 km

144

Variance slope @ 10 km

-999

Variance slope @ 20 km

-999


NDVI (max. NDVI composite)


Roman et al. (2009) index


St

4.81655014261

Rcv

0.221447017526

Rse

0.0

Rst

0.143129819213

Rsv

-0.258275601454


NDVI range @ 1km [-]

0.01

NDVI range @ 2km [-]

0.01

NDVI range @ 5km [-]

0.02

NDVI range @ 10km [-]

0.02

NDVI range @ 20km [-]

0.03


Variance slope @ 1 km

7.61327474069e-06

Variance slope @ 2 km

9.77310529231e-06

Variance slope @ 5 km

8.27985129948e-06

Variance slope @ 10 km

6.77516815392e-06

Variance slope @ 20 km

3.54008802131e-06


NDVI (min. NDVI composite)I


Roman et al. (2009) index


St

4.99482831211

Rcv

0.294724261635

Rse

0.0

Rst

0.0431718842156

Rsv

-0.262725099273


NDVI range @ 1km [-]

0.0

NDVI range @ 2km [-]

0.01

NDVI range @ 5km [-]

0.01

NDVI range @ 10km [-]

0.01

NDVI range @ 20km [-]

0.03


NDVI slope @ 1 km

2.90269980305e-06

NDVI slope @ 2 km

4.21153769526e-06

NDVI slope @ 5 km

4.81818057658e-06

NDVI slope @ 10 km

5.06706242875e-06

NDVI slope @ 20 km

3.22273824689e-06


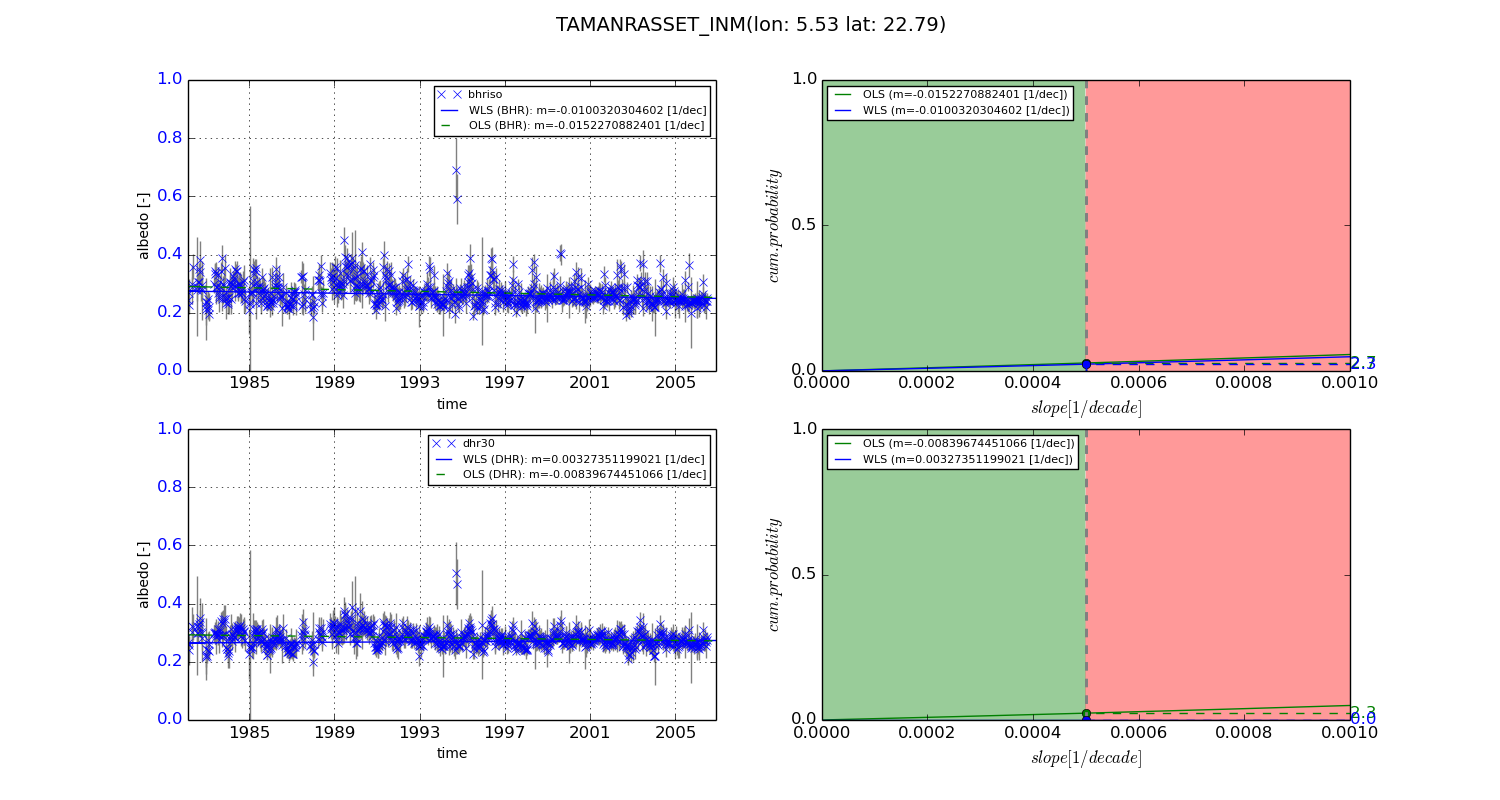
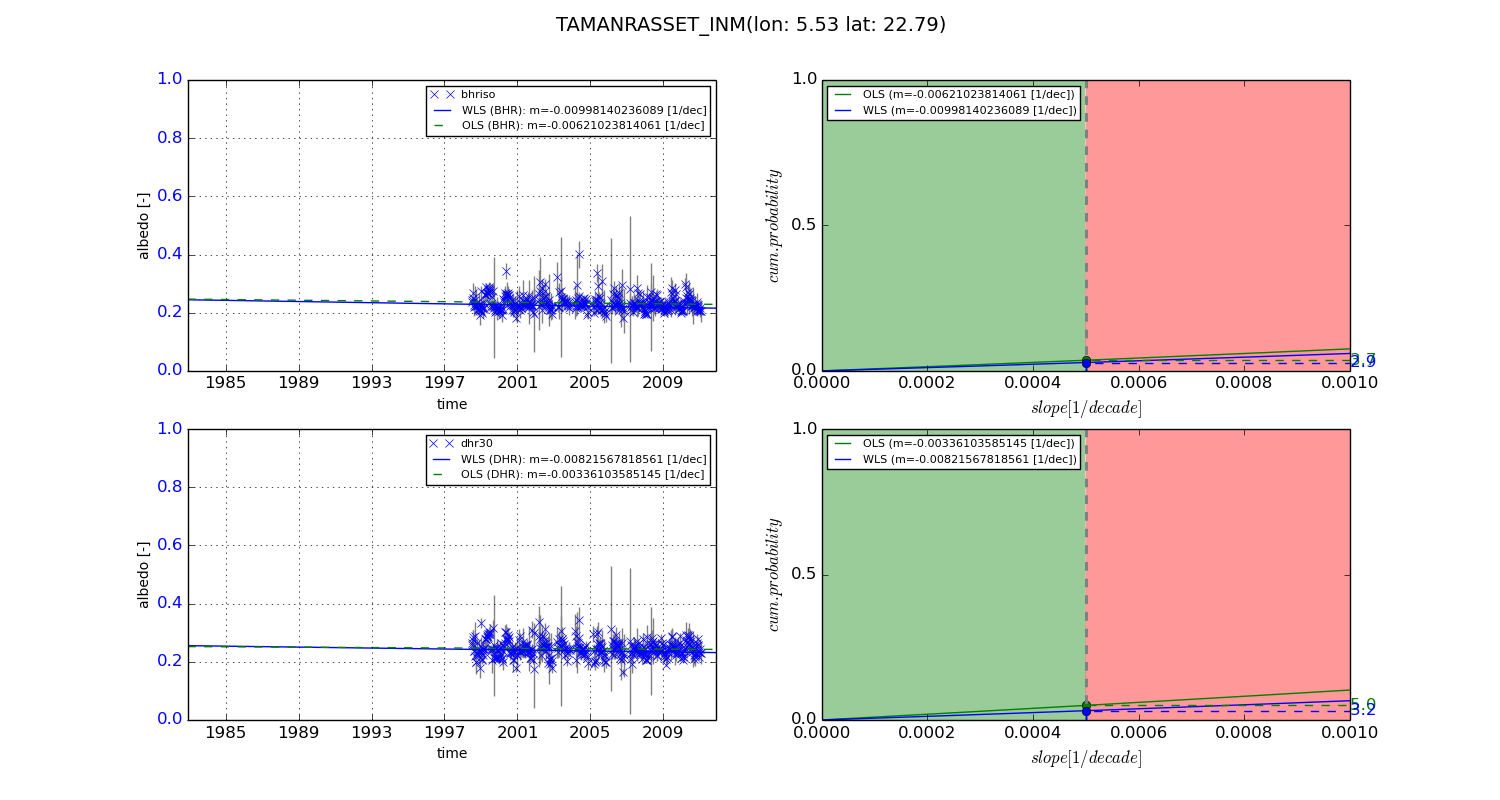
Temporal stability analysis

+000 deg (BHR)


BHR statistics

Temporal stability [1/decade]:


abs

rel


Weighted least square:

-0.0100320304602


Ordinary least square:

-0.0152270882401


Probabilities that GCOS criteria is met:

Weighted least square:

2.3 %

Ordinary least square:

2.7 %


DHR statistics

Temporal stability [1/decade]:


abs

rel


Weighted least square:

0.00327351199021


Ordinary least square:

-0.00839674451066


Probabilities that GCOS criteria is met:

Weighted least square:

0.0 %

Ordinary least square:

2.3 %


+057/+063 deg (BHR)


BHR statistics

Temporal stability [1/decade]:


abs

rel


Weighted least square:

-0.00998140236089


Ordinary least square:

-0.00621023814061


Probabilities that GCOS criteria is met:

Weighted least square:

2.9 %

Ordinary least square:

3.7 %


DHR statistics

Temporal stability [1/decade]:


abs

rel


Weighted least square:

-0.00821567818561


Ordinary least square:

-0.00336103585145


Probabilities that GCOS criteria is met:

Weighted least square:

3.2 %

Ordinary least square:

5.0 %


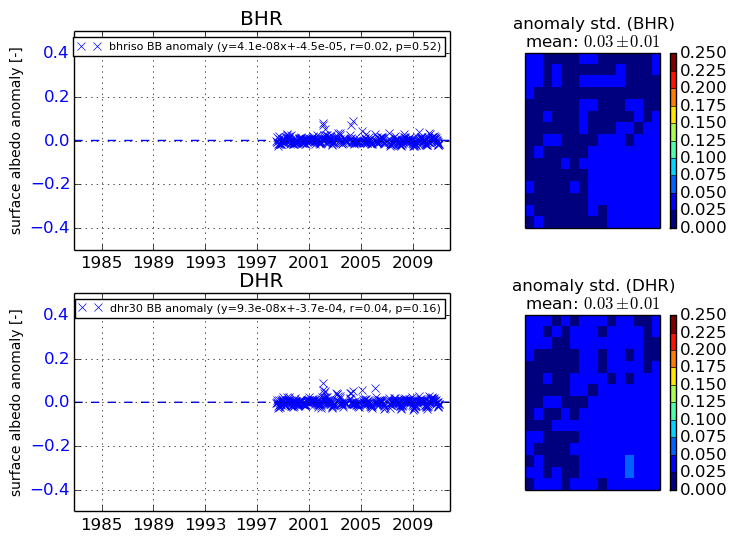
Temporal anomaly analyis

The variance of the temporal anomalies provides an additional measure about the stability of the signal AFTER removal of the mean seasonal cylce.
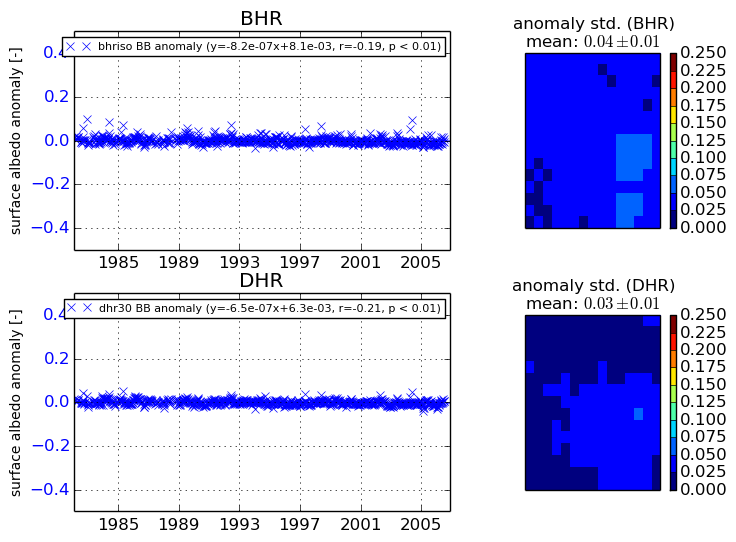
+000 deg


+057/+063 deg