TARBES_ETAL


Location

lon / lat [deg]: 0.0493 / 43.224

Source network: AERONET


Geostationary surface albedo (GSA) data


“+000”


“+057/+063”


Landcover information (based on ESA CCI landcover data)


Landcover fractions @ 2km distance


Landcover fractions @ 20 km distance


Legend


Distance to open water bodies [km]:

5.85

Distance to urban areas [km]:

0.07


Radius: 1 km

Number of landcover classes:

2

Dominant landcover type:

190: urban areas

Fraction of dominant landcover type [%]:

83.0


Radius: 2 km

Number of landcover classes:

4

Dominant landcover type:

190: urban areas

Fraction of dominant landcover type [%]:

61.0


Radius: 5 km

Number of landcover classes:

4

Dominant landcover type:

190: urban areas

Fraction of dominant landcover type [%]:

44.0


Radius: 10 km

Number of landcover classes:

8

Dominant landcover type:

10: cropland, rainfed

Fraction of dominant landcover type [%]:

32.0


Radius: 20 km

Number of landcover classes:

8

Dominant landcover type:

10: cropland, rainfed

Fraction of dominant landcover type [%]:

34.0


Disturbances


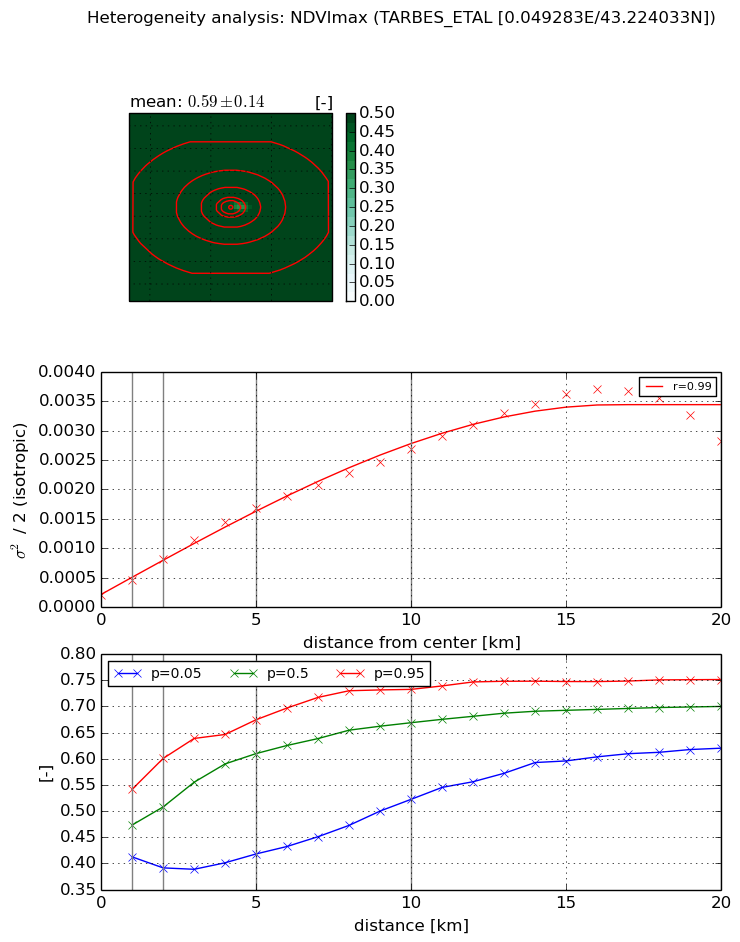
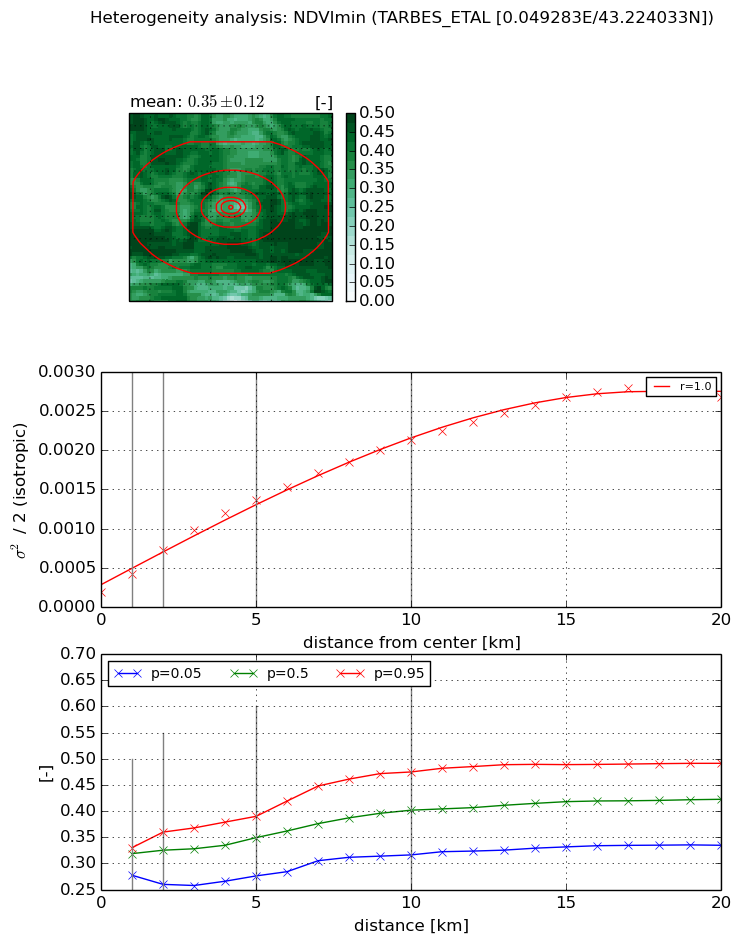
Heterogeneity analysis

The heterogeneity analysis provides information about the spatial and temporal heterogeneity of the site.

Topography


Roman et al. (2009) index


St

0.0163208782965

Rcv

0.905745295791

Rse

0.0

Rst

2.2735856822e-05

Rsv

182.907869047


Height range @ 1km [m]

15

Height range @ 2km [m]

26

Height range @ 5km [m]

65

Height range @ 10km [m]

-999

Height range @ 20km [m]

-999


Variance slope @ 1 km

78

Variance slope @ 2 km

73

Variance slope @ 5 km

96

Variance slope @ 10 km

-999

Variance slope @ 20 km

-999


NDVI (max. NDVI composite)


Roman et al. (2009) index


St

4.55266088165

Rcv

-0.173131718117

Rse

0.0

Rst

0.211651649038

Rsv

-0.274171929097


NDVI range @ 1km [-]

0.13

NDVI range @ 2km [-]

0.21

NDVI range @ 5km [-]

0.26

NDVI range @ 10km [-]

0.21

NDVI range @ 20km [-]

0.13


Variance slope @ 1 km

0.000250244192912

Variance slope @ 2 km

0.000304681300343

Variance slope @ 5 km

0.000306651689278

Variance slope @ 10 km

0.000246846034628

Variance slope @ 20 km

0.00016396147442


NDVI (min. NDVI composite)I


Roman et al. (2009) index


St

7.71428281495

Rcv

-0.107817774097

Rse

0.0

Rst

0.125330404521

Rsv

-0.155740856431


NDVI range @ 1km [-]

0.05

NDVI range @ 2km [-]

0.1

NDVI range @ 5km [-]

0.11

NDVI range @ 10km [-]

0.16

NDVI range @ 20km [-]

0.16


NDVI slope @ 1 km

0.000232662943823

NDVI slope @ 2 km

0.000271284457932

NDVI slope @ 5 km

0.000242753148438

NDVI slope @ 10 km

0.000192472019398

NDVI slope @ 20 km

0.000128455852923


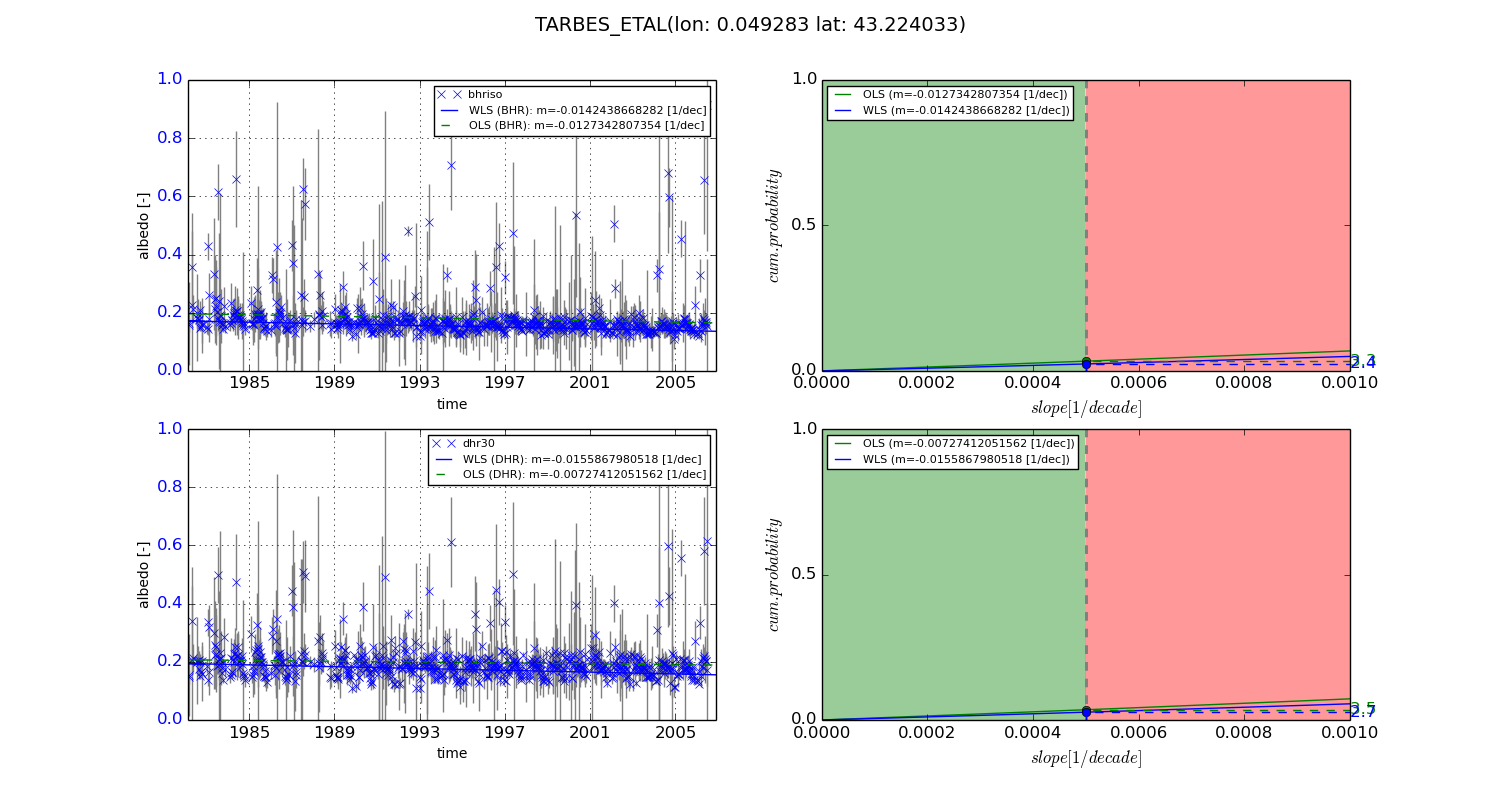
Temporal stability analysis

+000 deg (BHR)


BHR statistics

Temporal stability [1/decade]:


abs

rel


Weighted least square:

-0.0142438668282


Ordinary least square:

-0.0127342807354


Probabilities that GCOS criteria is met:

Weighted least square:

2.4 %

Ordinary least square:

3.3 %


DHR statistics

Temporal stability [1/decade]:


abs

rel


Weighted least square:

-0.0155867980518


Ordinary least square:

-0.00727412051562


Probabilities that GCOS criteria is met:

Weighted least square:

2.7 %

Ordinary least square:

3.5 %


+057/+063 deg (BHR)


BHR statistics

Temporal stability [1/decade]:


abs

rel


Weighted least square:

-99999.0


Ordinary least square:

-99999.0


Probabilities that GCOS criteria is met:

Weighted least square:

-99999.0 %

Ordinary least square:

-99999.0 %


DHR statistics

Temporal stability [1/decade]:


abs

rel


Weighted least square:

-99999.0


Ordinary least square:

-99999.0


Probabilities that GCOS criteria is met:

Weighted least square:

-99999.0 %

Ordinary least square:

-99999.0 %


Temporal anomaly analyis

The variance of the temporal anomalies provides an additional measure about the stability of the signal AFTER removal of the mean seasonal cylce.
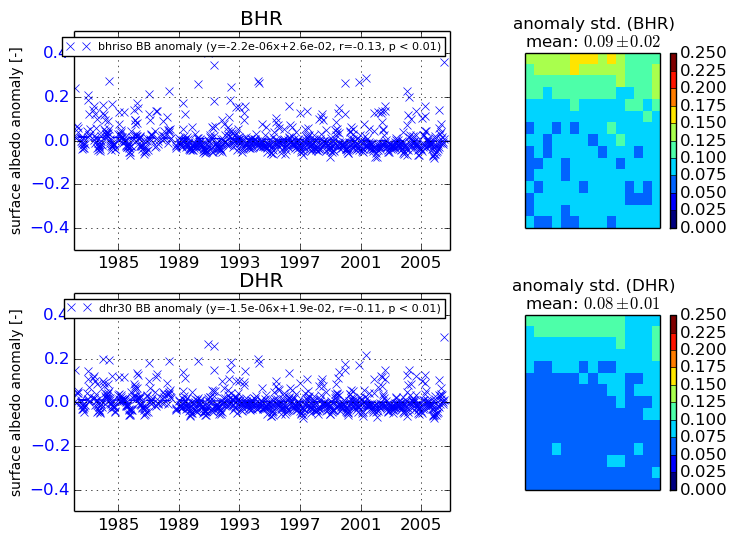
+000 deg


+057/+063 deg