TARBES


Location

lon / lat [deg]: 0.0833 / 43.25

Source network: AERONET


Geostationary surface albedo (GSA) data


“+000”


“+057/+063”


Landcover information (based on ESA CCI landcover data)


Landcover fractions @ 2km distance


Landcover fractions @ 20 km distance


Legend


Distance to open water bodies [km]:

2.33

Distance to urban areas [km]:

0.19


Radius: 1 km

Number of landcover classes:

2

Dominant landcover type:

190: urban areas

Fraction of dominant landcover type [%]:

73.0


Radius: 2 km

Number of landcover classes:

4

Dominant landcover type:

190: urban areas

Fraction of dominant landcover type [%]:

63.0


Radius: 5 km

Number of landcover classes:

4

Dominant landcover type:

190: urban areas

Fraction of dominant landcover type [%]:

41.0


Radius: 10 km

Number of landcover classes:

6

Dominant landcover type:

10: cropland, rainfed

Fraction of dominant landcover type [%]:

42.0


Radius: 20 km

Number of landcover classes:

8

Dominant landcover type:

10: cropland, rainfed

Fraction of dominant landcover type [%]:

41.0


Disturbances


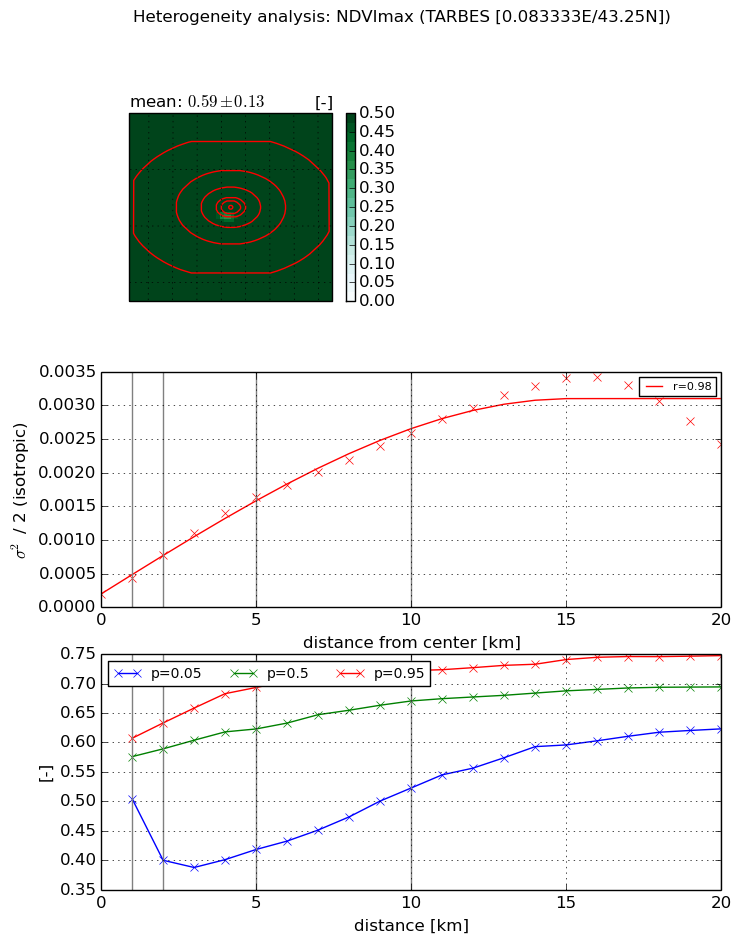
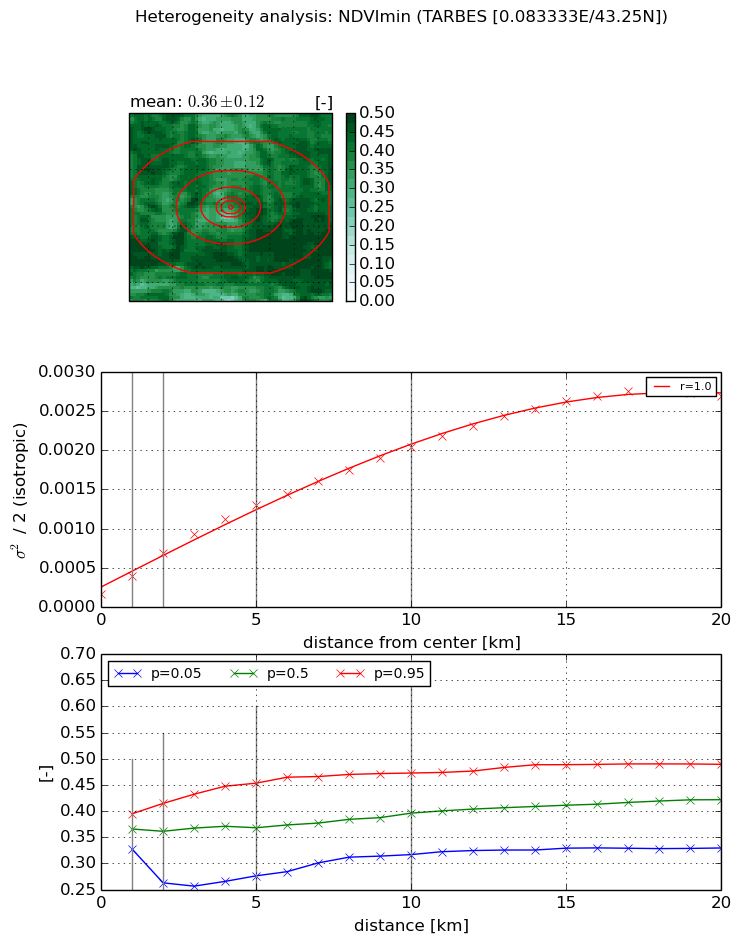
Heterogeneity analysis

The heterogeneity analysis provides information about the spatial and temporal heterogeneity of the site.

Topography


Roman et al. (2009) index


St

2.08753677448

Rcv

0.808233876114

Rse

0.0

Rst

-1.19756929384e-05

Rsv

-0.62885457999


Height range @ 1km [m]

14

Height range @ 2km [m]

25

Height range @ 5km [m]

89

Height range @ 10km [m]

-999

Height range @ 20km [m]

-999


Variance slope @ 1 km

199

Variance slope @ 2 km

163

Variance slope @ 5 km

168

Variance slope @ 10 km

-999

Variance slope @ 20 km

-999


NDVI (max. NDVI composite)


Roman et al. (2009) index


St

9.94950431652

Rcv

-0.0854406917709

Rse

0.0

Rst

0.120821803341

Rsv

0.0952600636569


NDVI range @ 1km [-]

0.1

NDVI range @ 2km [-]

0.23

NDVI range @ 5km [-]

0.28

NDVI range @ 10km [-]

0.2

NDVI range @ 20km [-]

0.12


Variance slope @ 1 km

0.000235456038294

Variance slope @ 2 km

0.000288748326661

Variance slope @ 5 km

0.000297011155001

Variance slope @ 10 km

0.000238930464264

Variance slope @ 20 km

0.000142052587265


NDVI (min. NDVI composite)I


Roman et al. (2009) index


St

1.34506369259

Rcv

-0.0254553778199

Rse

0.0

Rst

0.142260349556

Rsv

2.06266192428


NDVI range @ 1km [-]

0.07

NDVI range @ 2km [-]

0.15

NDVI range @ 5km [-]

0.18

NDVI range @ 10km [-]

0.16

NDVI range @ 20km [-]

0.16


NDVI slope @ 1 km

0.000223435863062

NDVI slope @ 2 km

0.000259274592965

NDVI slope @ 5 km

0.000229945387416

NDVI slope @ 10 km

0.000183747500569

NDVI slope @ 20 km

0.000129476046657


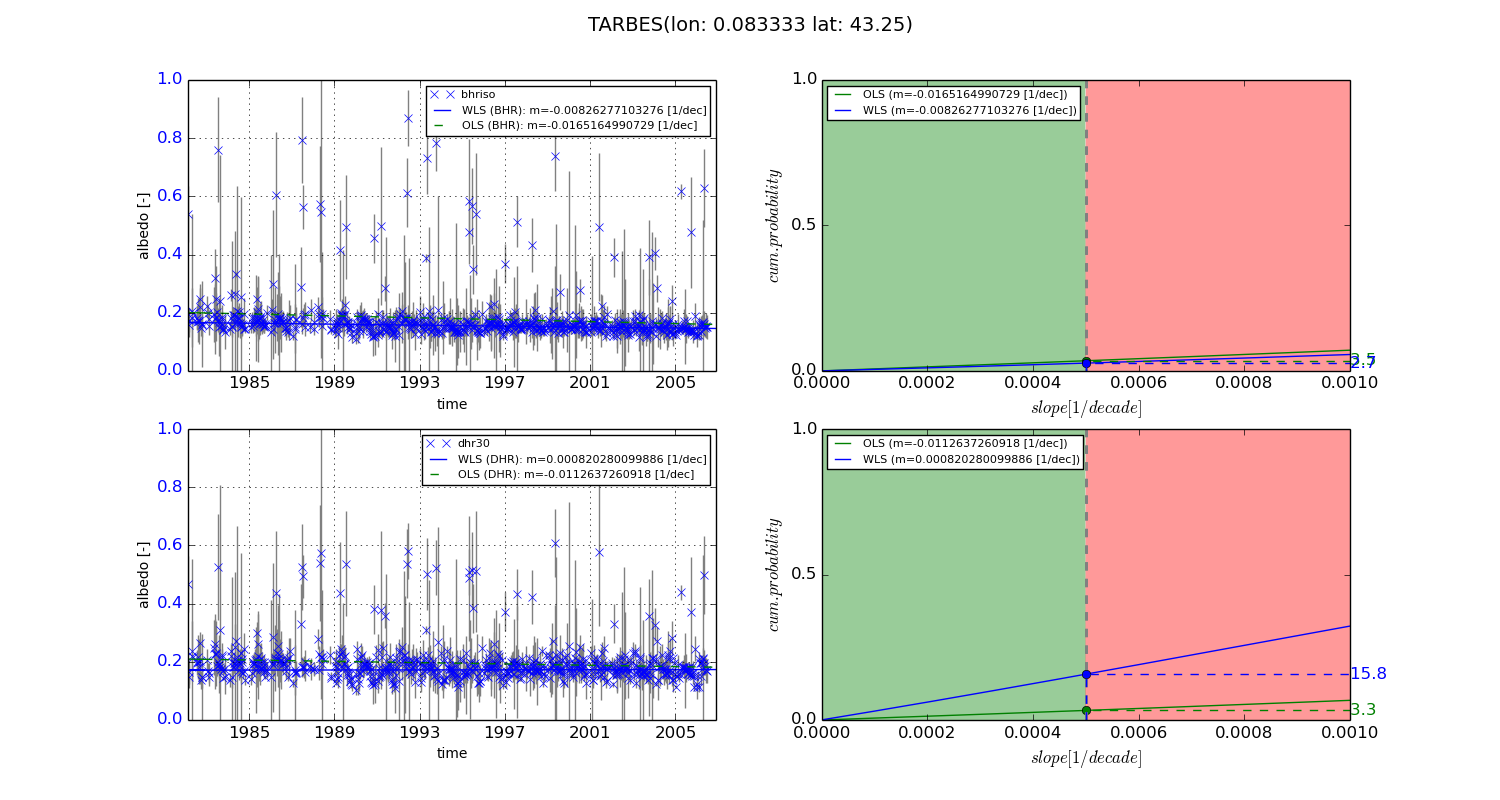
Temporal stability analysis

+000 deg (BHR)


BHR statistics

Temporal stability [1/decade]:


abs

rel


Weighted least square:

-0.00826277103276


Ordinary least square:

-0.0165164990729


Probabilities that GCOS criteria is met:

Weighted least square:

2.7 %

Ordinary least square:

3.5 %


DHR statistics

Temporal stability [1/decade]:


abs

rel


Weighted least square:

0.000820280099886


Ordinary least square:

-0.0112637260918


Probabilities that GCOS criteria is met:

Weighted least square:

15.8 %

Ordinary least square:

3.3 %


+057/+063 deg (BHR)


BHR statistics

Temporal stability [1/decade]:


abs

rel


Weighted least square:

-99999.0


Ordinary least square:

-99999.0


Probabilities that GCOS criteria is met:

Weighted least square:

-99999.0 %

Ordinary least square:

-99999.0 %


DHR statistics

Temporal stability [1/decade]:


abs

rel


Weighted least square:

-99999.0


Ordinary least square:

-99999.0


Probabilities that GCOS criteria is met:

Weighted least square:

-99999.0 %

Ordinary least square:

-99999.0 %


Temporal anomaly analyis

The variance of the temporal anomalies provides an additional measure about the stability of the signal AFTER removal of the mean seasonal cylce.
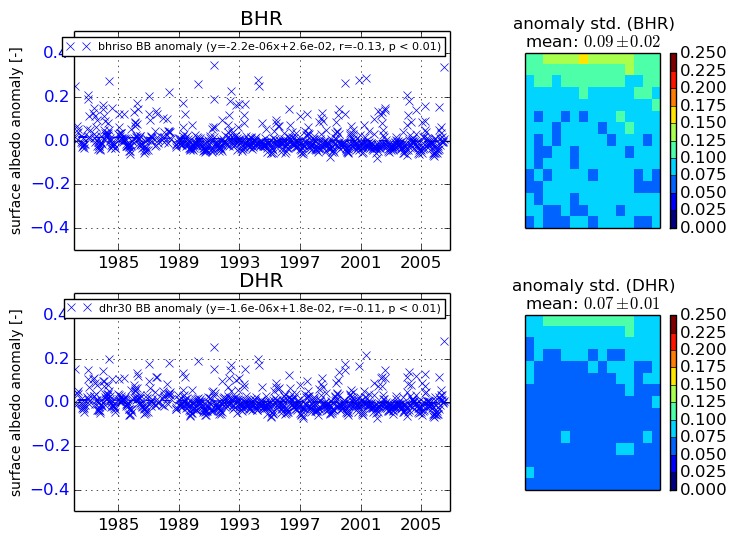
+000 deg


+057/+063 deg