TASSILI


Location

lon / lat [deg]: 5.847 / 26.667

Source network: ALBEDOVAL2


Geostationary surface albedo (GSA) data


“+000”


“+057/+063”


Landcover information (based on ESA CCI landcover data)


Landcover fractions @ 2km distance


Landcover fractions @ 20 km distance


Legend


Distance to open water bodies [km]:

none in region

Distance to urban areas [km]:

none in region


Radius: 1 km

Number of landcover classes:

1

Dominant landcover type:

200: bare areas

Fraction of dominant landcover type [%]:

100.0


Radius: 2 km

Number of landcover classes:

1

Dominant landcover type:

200: bare areas

Fraction of dominant landcover type [%]:

100.0


Radius: 5 km

Number of landcover classes:

1

Dominant landcover type:

200: bare areas

Fraction of dominant landcover type [%]:

100.0


Radius: 10 km

Number of landcover classes:

1

Dominant landcover type:

200: bare areas

Fraction of dominant landcover type [%]:

100.0


Radius: 20 km

Number of landcover classes:

1

Dominant landcover type:

200: bare areas

Fraction of dominant landcover type [%]:

100.0


Disturbances


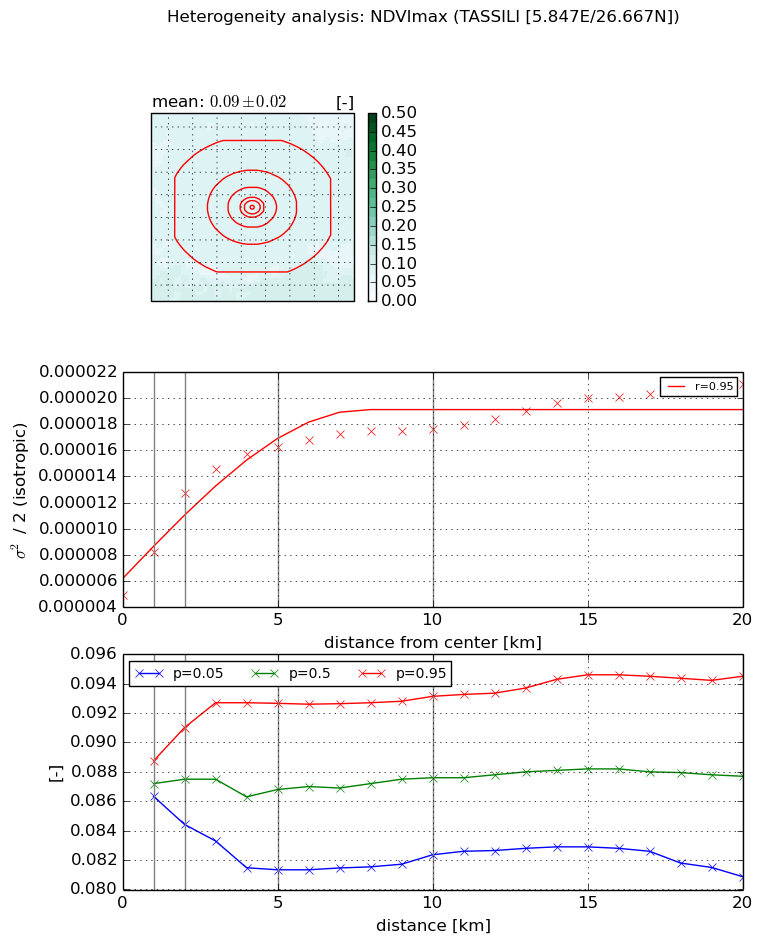
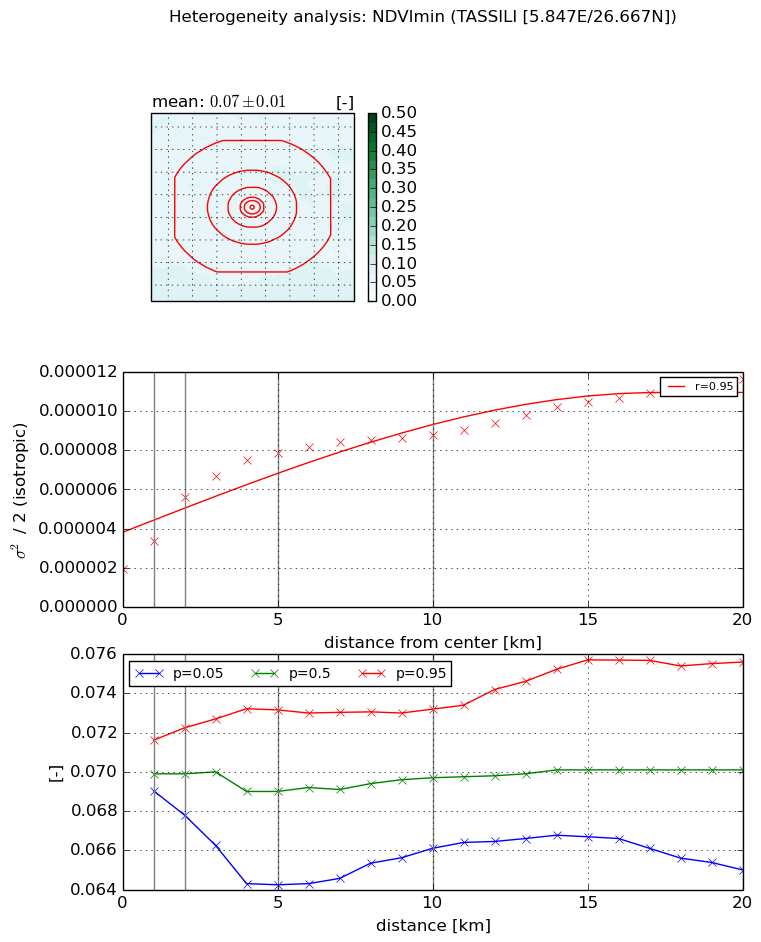
Heterogeneity analysis

The heterogeneity analysis provides information about the spatial and temporal heterogeneity of the site.

Topography


Roman et al. (2009) index


St

1.91087642912e-07

Rcv

0.0753340483707

Rse

0.0

Rst

-0.0796928638367

Rsv

15699602.1546


Height range @ 1km [m]

125

Height range @ 2km [m]

209

Height range @ 5km [m]

294

Height range @ 10km [m]

-999

Height range @ 20km [m]

-999


Variance slope @ 1 km

3740

Variance slope @ 2 km

2522

Variance slope @ 5 km

1451

Variance slope @ 10 km

-999

Variance slope @ 20 km

-999


NDVI (max. NDVI composite)


Roman et al. (2009) index


St

1.50972916903

Rcv

0.226203147328

Rse

0.0

Rst

-0.397330079711

Rsv

1.36357814469


NDVI range @ 1km [-]

0.0

NDVI range @ 2km [-]

0.01

NDVI range @ 5km [-]

0.01

NDVI range @ 10km [-]

0.01

NDVI range @ 20km [-]

0.01


Variance slope @ 1 km

3.27971547738e-06

Variance slope @ 2 km

3.90178550102e-06

Variance slope @ 5 km

2.31241708342e-06

Variance slope @ 10 km

1.10026035575e-06

Variance slope @ 20 km

5.71235686537e-07


NDVI (min. NDVI composite)I


Roman et al. (2009) index


St

1.76239274006

Rcv

0.293230981962

Rse

0.0

Rst

-0.319206189434

Rsv

1.08979408036


NDVI range @ 1km [-]

0.0

NDVI range @ 2km [-]

0.0

NDVI range @ 5km [-]

0.01

NDVI range @ 10km [-]

0.01

NDVI range @ 20km [-]

0.01


NDVI slope @ 1 km

1.44851570614e-06

NDVI slope @ 2 km

1.83968577714e-06

NDVI slope @ 5 km

1.22390364723e-06

NDVI slope @ 10 km

6.16952353357e-07

NDVI slope @ 20 km

3.74929693033e-07


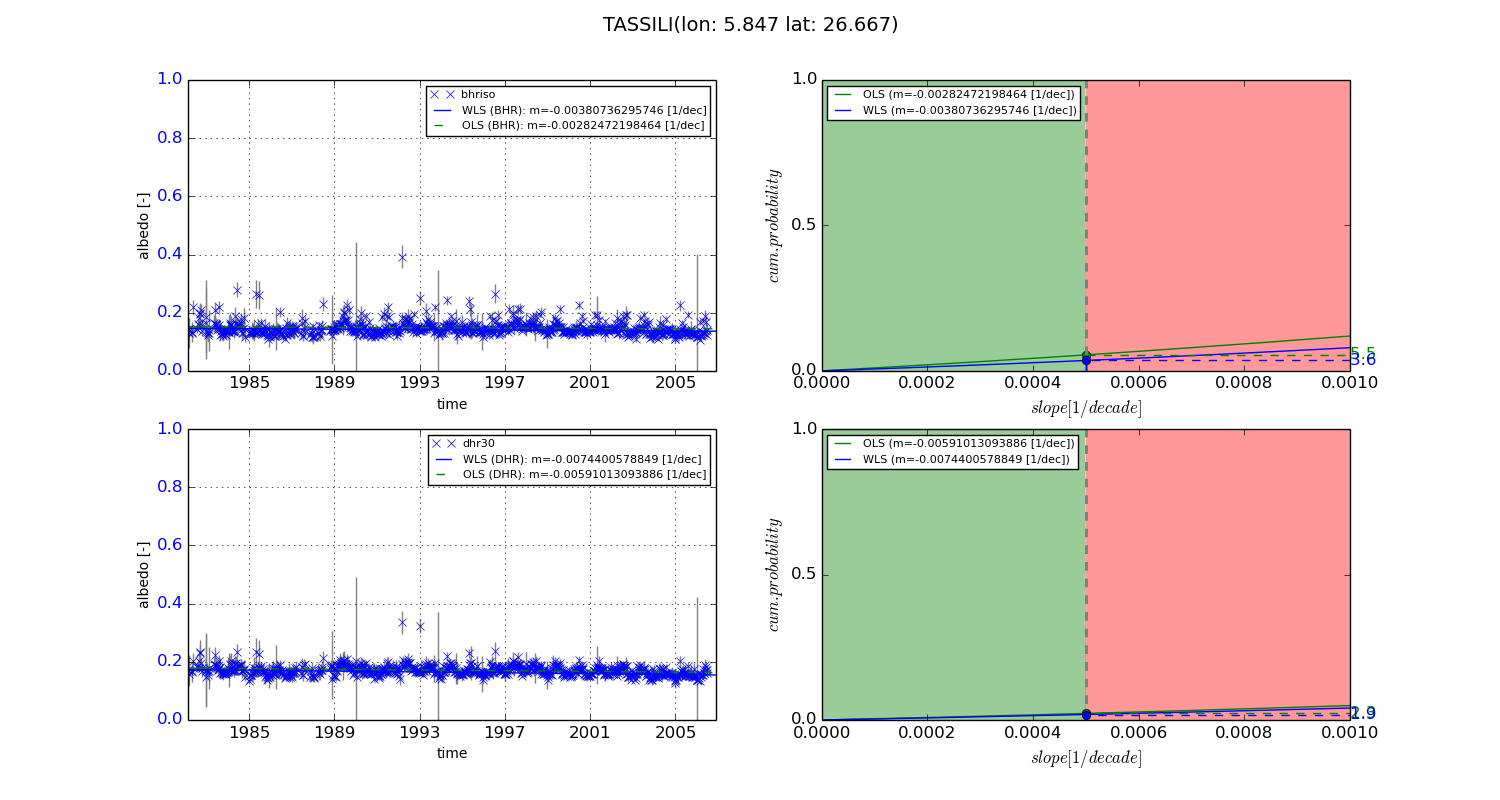
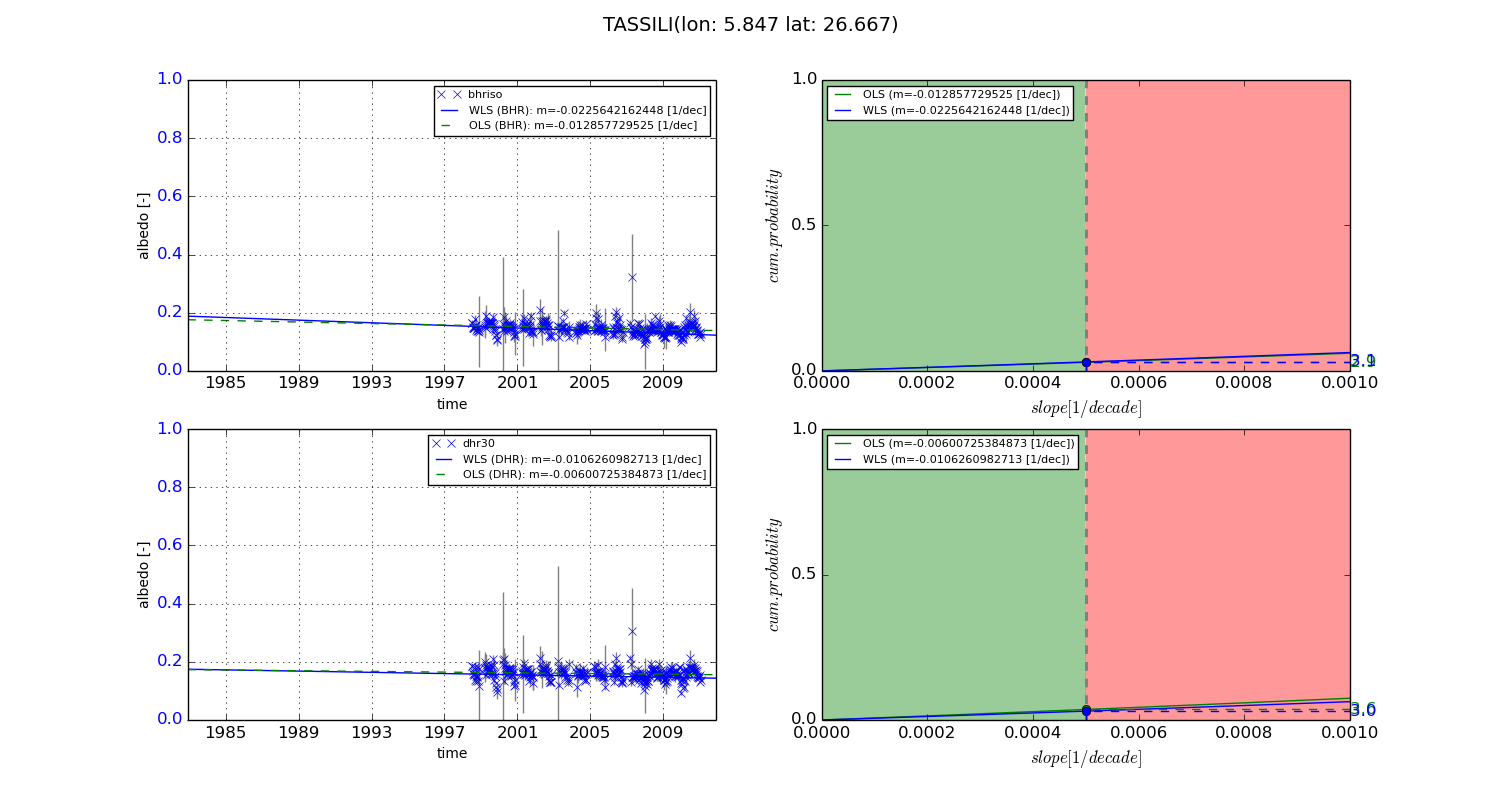
Temporal stability analysis

+000 deg (BHR)


BHR statistics

Temporal stability [1/decade]:


abs

rel


Weighted least square:

-0.00380736295746


Ordinary least square:

-0.00282472198464


Probabilities that GCOS criteria is met:

Weighted least square:

3.6 %

Ordinary least square:

5.5 %


DHR statistics

Temporal stability [1/decade]:


abs

rel


Weighted least square:

-0.0074400578849


Ordinary least square:

-0.00591013093886


Probabilities that GCOS criteria is met:

Weighted least square:

1.9 %

Ordinary least square:

2.3 %


+057/+063 deg (BHR)


BHR statistics

Temporal stability [1/decade]:


abs

rel


Weighted least square:

-0.0225642162448


Ordinary least square:

-0.012857729525


Probabilities that GCOS criteria is met:

Weighted least square:

3.1 %

Ordinary least square:

2.9 %


DHR statistics

Temporal stability [1/decade]:


abs

rel


Weighted least square:

-0.0106260982713


Ordinary least square:

-0.00600725384873


Probabilities that GCOS criteria is met:

Weighted least square:

3.0 %

Ordinary least square:

3.6 %


Temporal anomaly analyis

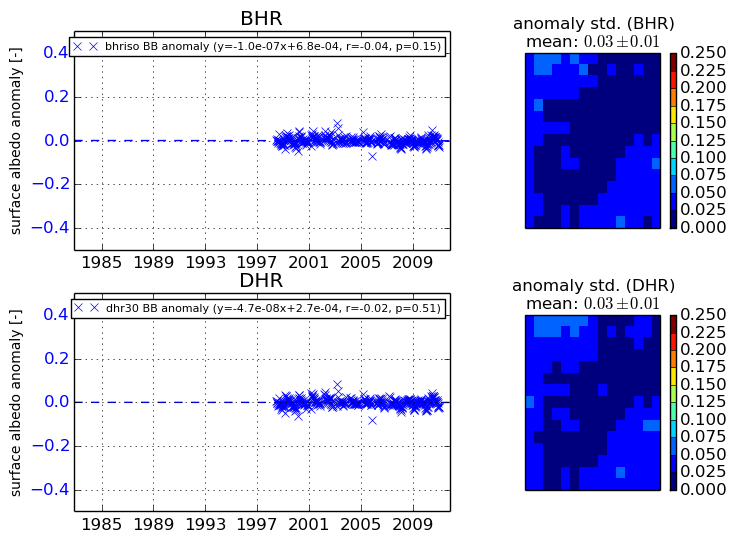
The variance of the temporal anomalies provides an additional measure about the stability of the signal AFTER removal of the mean seasonal cylce.
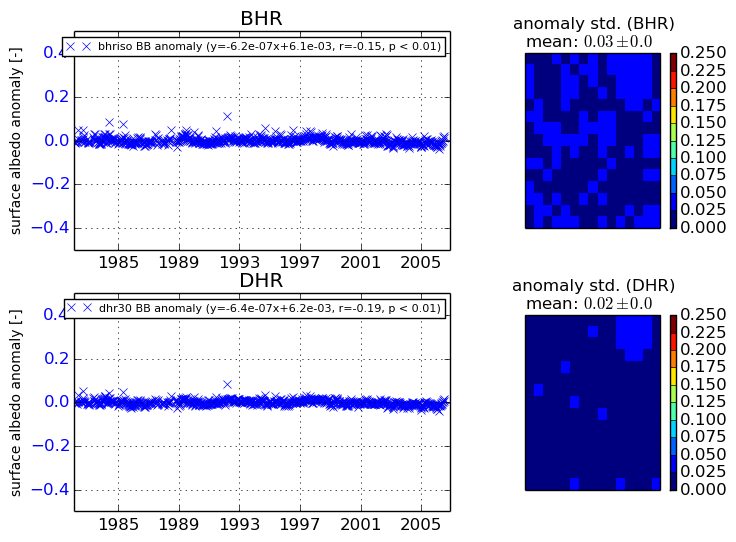
+000 deg


+057/+063 deg