TAT


Location

lon / lat [deg]: 140.1333 / 36.05

Source network: BSRN


Geostationary surface albedo (GSA) data


“+000”


“+057/+063”


Landcover information (based on ESA CCI landcover data)


Landcover fractions @ 2km distance


Landcover fractions @ 20 km distance


Legend


Distance to open water bodies [km]:

6.39

Distance to urban areas [km]:

0.2


Radius: 1 km

Number of landcover classes:

2

Dominant landcover type:

190: urban areas

Fraction of dominant landcover type [%]:

59.0


Radius: 2 km

Number of landcover classes:

3

Dominant landcover type:

11: cropland, rainfed, herbaceous cover

Fraction of dominant landcover type [%]:

57.0


Radius: 5 km

Number of landcover classes:

3

Dominant landcover type:

11: cropland, rainfed, herbaceous cover

Fraction of dominant landcover type [%]:

54.0


Radius: 10 km

Number of landcover classes:

5

Dominant landcover type:

11: cropland, rainfed, herbaceous cover

Fraction of dominant landcover type [%]:

59.0


Radius: 20 km

Number of landcover classes:

6

Dominant landcover type:

11: cropland, rainfed, herbaceous cover

Fraction of dominant landcover type [%]:

61.0


Disturbances


Heterogeneity analysis

The heterogeneity analysis provides information about the spatial and temporal heterogeneity of the site.

Topography


Roman et al. (2009) index


St

4.42312207669

Rcv

0.260752779614

Rse

0.0

Rst

0.0854400087876

Rsv

-0.332061157111


Height range @ 1km [m]

9

Height range @ 2km [m]

11

Height range @ 5km [m]

16

Height range @ 10km [m]

-999

Height range @ 20km [m]

-999


Variance slope @ 1 km

21

Variance slope @ 2 km

12

Variance slope @ 5 km

5

Variance slope @ 10 km

-999

Variance slope @ 20 km

-999


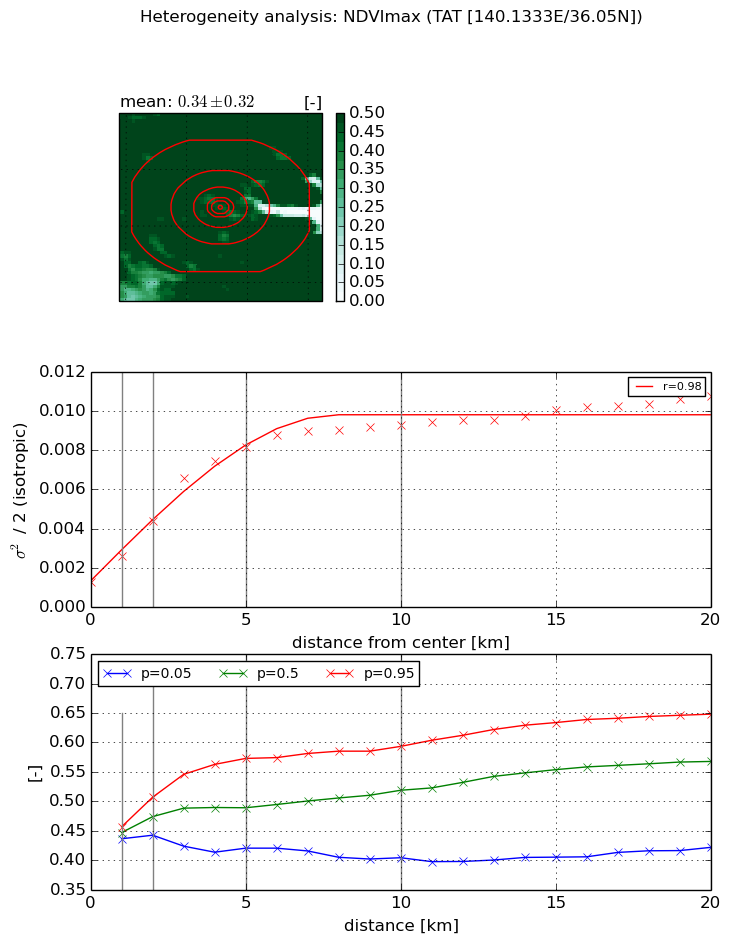
NDVI (max. NDVI composite)


Roman et al. (2009) index


St

8.10088517151

Rcv

0.193459365552

Rse

0.0

Rst

0.0201930757462

Rsv

0.15667745926


NDVI range @ 1km [-]

0.02

NDVI range @ 2km [-]

0.06

NDVI range @ 5km [-]

0.15

NDVI range @ 10km [-]

0.19

NDVI range @ 20km [-]

0.23


Variance slope @ 1 km

0.00128559110353

Variance slope @ 2 km

0.00154682156679

Variance slope @ 5 km

0.00146139789524

Variance slope @ 10 km

0.000783687822657

Variance slope @ 20 km

0.000354655802738


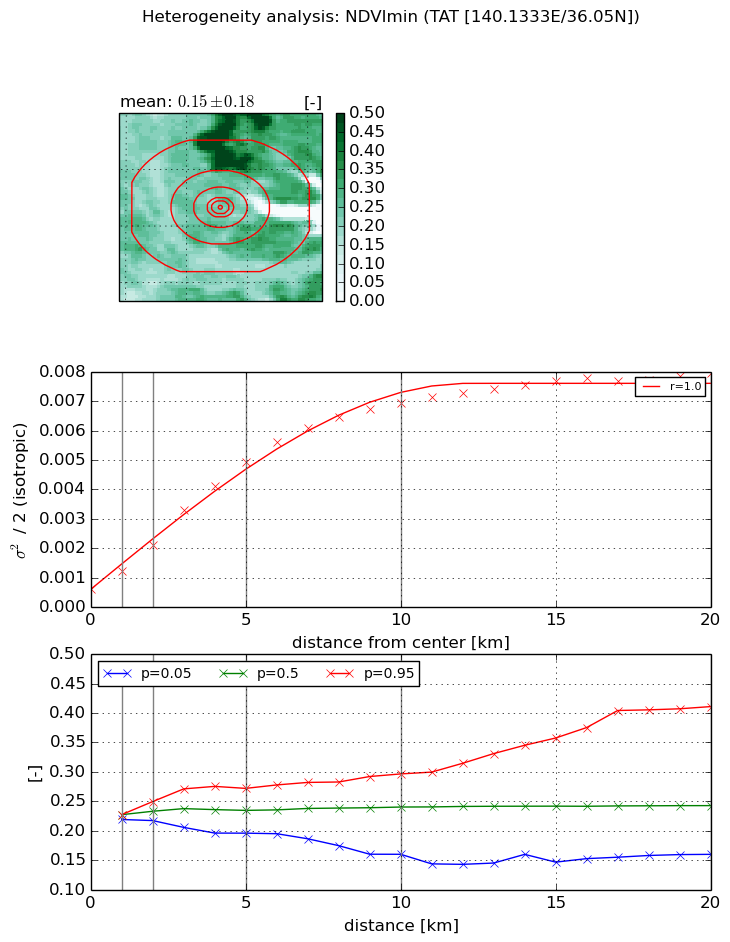
NDVI (min. NDVI composite)I


Roman et al. (2009) index


St

3.25570749236

Rcv

0.203346452396

Rse

0.0

Rst

-0.513324749002

Rsv

0.204787500601


NDVI range @ 1km [-]

0.01

NDVI range @ 2km [-]

0.03

NDVI range @ 5km [-]

0.08

NDVI range @ 10km [-]

0.14

NDVI range @ 20km [-]

0.25


NDVI slope @ 1 km

0.000639231333224

NDVI slope @ 2 km

0.000757670272208

NDVI slope @ 5 km

0.000900493341857

NDVI slope @ 10 km

0.00067150419112

NDVI slope @ 20 km

0.000335394601365


Temporal stability analysis

+000 deg (BHR)


BHR statistics

Temporal stability [1/decade]:


abs

rel


Weighted least square:

None


Ordinary least square:

None


Probabilities that GCOS criteria is met:

Weighted least square:

None %

Ordinary least square:

None %


DHR statistics

Temporal stability [1/decade]:


abs

rel


Weighted least square:

None


Ordinary least square:

None


Probabilities that GCOS criteria is met:

Weighted least square:

None %

Ordinary least square:

None %


+057/+063 deg (BHR)


BHR statistics

Temporal stability [1/decade]:


abs

rel


Weighted least square:

None


Ordinary least square:

None


Probabilities that GCOS criteria is met:

Weighted least square:

None %

Ordinary least square:

None %


DHR statistics

Temporal stability [1/decade]:


abs

rel


Weighted least square:

None


Ordinary least square:

None


Probabilities that GCOS criteria is met:

Weighted least square:

None %

Ordinary least square:

None %


Temporal anomaly analyis

The variance of the temporal anomalies provides an additional measure about the stability of the signal AFTER removal of the mean seasonal cylce.

+000 deg


+057/+063 deg