TELES_PERES


Location

lon / lat [deg]: -56.02 / -9.6679

Source network: AERONET


Geostationary surface albedo (GSA) data


“+000”


“+057/+063”


Landcover information (based on ESA CCI landcover data)


Landcover fractions @ 2km distance


Landcover fractions @ 20 km distance


Legend


Distance to open water bodies [km]:

2.8

Distance to urban areas [km]:

none in region


Radius: 1 km

Number of landcover classes:

2

Dominant landcover type:

50: Tree cover, broadleaved, evergreen, closed to open (>15%)

Fraction of dominant landcover type [%]:

79.0


Radius: 2 km

Number of landcover classes:

4

Dominant landcover type:

50: Tree cover, broadleaved, evergreen, closed to open (>15%)

Fraction of dominant landcover type [%]:

77.0


Radius: 5 km

Number of landcover classes:

7

Dominant landcover type:

50: Tree cover, broadleaved, evergreen, closed to open (>15%)

Fraction of dominant landcover type [%]:

66.0


Radius: 10 km

Number of landcover classes:

7

Dominant landcover type:

50: Tree cover, broadleaved, evergreen, closed to open (>15%)

Fraction of dominant landcover type [%]:

75.0


Radius: 20 km

Number of landcover classes:

7

Dominant landcover type:

50: Tree cover, broadleaved, evergreen, closed to open (>15%)

Fraction of dominant landcover type [%]:

72.0


Disturbances


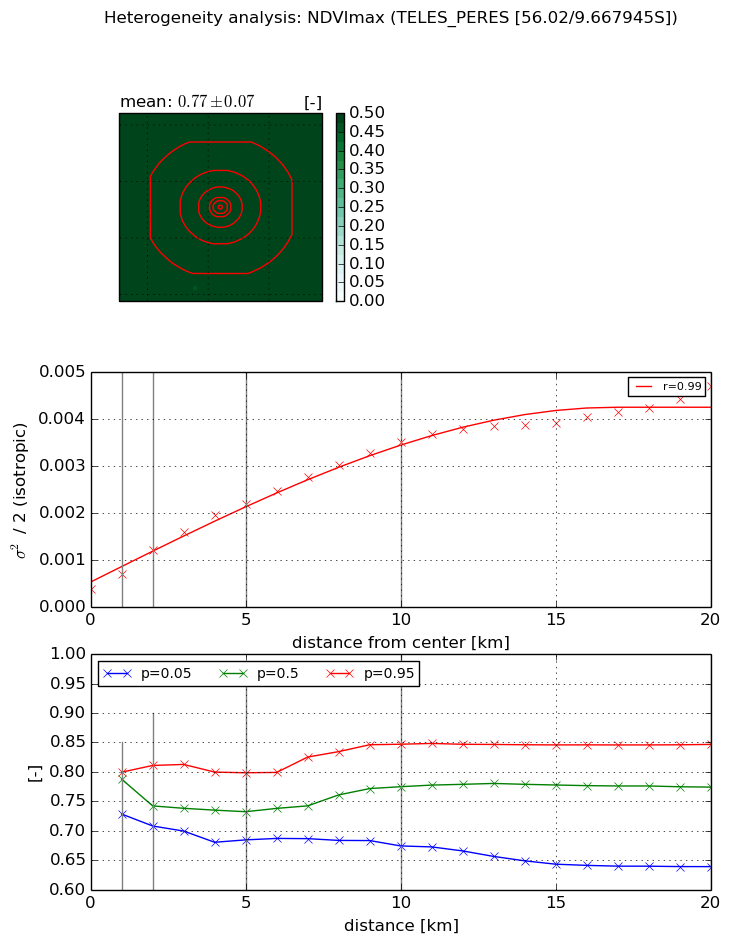
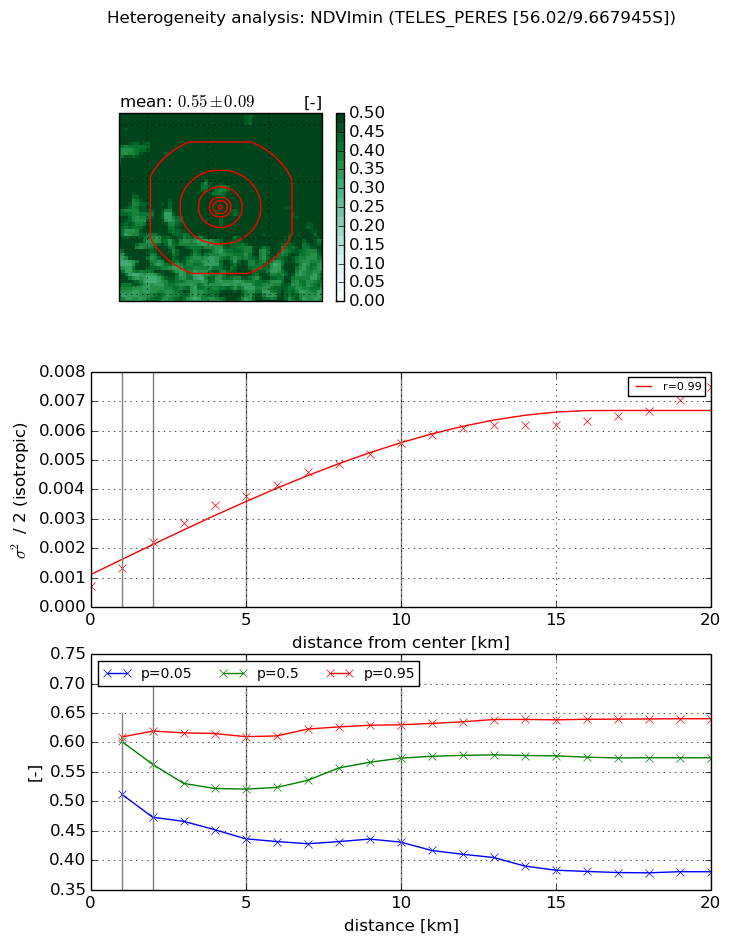
Heterogeneity analysis

The heterogeneity analysis provides information about the spatial and temporal heterogeneity of the site.

Topography


Roman et al. (2009) index


St

0.766092071955

Rcv

0.250347831405

Rse

0.0

Rst

3.87796463421e-06

Rsv

3.66562668256


Height range @ 1km [m]

16

Height range @ 2km [m]

30

Height range @ 5km [m]

46

Height range @ 10km [m]

-999

Height range @ 20km [m]

-999


Variance slope @ 1 km

12

Variance slope @ 2 km

24

Variance slope @ 5 km

56

Variance slope @ 10 km

-999

Variance slope @ 20 km

-999


NDVI (max. NDVI composite)


Roman et al. (2009) index


St

50.4936096373

Rcv

0.028712251316

Rse

0.0

Rst

-0.00750689741641

Rsv

-0.0231943101499


NDVI range @ 1km [-]

0.07

NDVI range @ 2km [-]

0.1

NDVI range @ 5km [-]

0.11

NDVI range @ 10km [-]

0.17

NDVI range @ 20km [-]

0.21


Variance slope @ 1 km

0.000324552865312

Variance slope @ 2 km

0.000417294558285

Variance slope @ 5 km

0.000375468752458

Variance slope @ 10 km

0.000310564104889

Variance slope @ 20 km

0.000195020524672


NDVI (min. NDVI composite)I


Roman et al. (2009) index


St

20.1331151005

Rcv

0.111190202368

Rse

0.0

Rst

-0.0233247515104

Rsv

0.0144932837948


NDVI range @ 1km [-]

0.1

NDVI range @ 2km [-]

0.15

NDVI range @ 5km [-]

0.17

NDVI range @ 10km [-]

0.2

NDVI range @ 20km [-]

0.26


NDVI slope @ 1 km

0.000585533242575

NDVI slope @ 2 km

0.000744266431388

NDVI slope @ 5 km

0.000637994450129

NDVI slope @ 10 km

0.000470729325626

NDVI slope @ 20 km

0.000292815168999


Temporal stability analysis

+000 deg (BHR)


BHR statistics

Temporal stability [1/decade]:


abs

rel


Weighted least square:

-99999.0


Ordinary least square:

-99999.0


Probabilities that GCOS criteria is met:

Weighted least square:

-99999.0 %

Ordinary least square:

-99999.0 %


DHR statistics

Temporal stability [1/decade]:


abs

rel


Weighted least square:

-99999.0


Ordinary least square:

-99999.0


Probabilities that GCOS criteria is met:

Weighted least square:

-99999.0 %

Ordinary least square:

-99999.0 %


+057/+063 deg (BHR)


BHR statistics

Temporal stability [1/decade]:


abs

rel


Weighted least square:

None


Ordinary least square:

None


Probabilities that GCOS criteria is met:

Weighted least square:

None %

Ordinary least square:

None %


DHR statistics

Temporal stability [1/decade]:


abs

rel


Weighted least square:

None


Ordinary least square:

None


Probabilities that GCOS criteria is met:

Weighted least square:

None %

Ordinary least square:

None %


Temporal anomaly analyis

The variance of the temporal anomalies provides an additional measure about the stability of the signal AFTER removal of the mean seasonal cylce.

+000 deg


+057/+063 deg