THOMPSON


Location

lon / lat [deg]: -97.85 / 55.8

Source network: AERONET


Geostationary surface albedo (GSA) data


“+000”


“+057/+063”


Landcover information (based on ESA CCI landcover data)


Landcover fractions @ 2km distance


Landcover fractions @ 20 km distance


Legend


Distance to open water bodies [km]:

2.94

Distance to urban areas [km]:

5.42


Radius: 1 km

Number of landcover classes:

5

Dominant landcover type:

180: shrub or herbaceous cover, flooded, fresh/saline/brakish water

Fraction of dominant landcover type [%]:

45.0


Radius: 2 km

Number of landcover classes:

5

Dominant landcover type:

70: Tree cover, needleleaved, evergreen, closed to open (>15%)

Fraction of dominant landcover type [%]:

61.0


Radius: 5 km

Number of landcover classes:

5

Dominant landcover type:

70: Tree cover, needleleaved, evergreen, closed to open (>15%)

Fraction of dominant landcover type [%]:

81.0


Radius: 10 km

Number of landcover classes:

6

Dominant landcover type:

70: Tree cover, needleleaved, evergreen, closed to open (>15%)

Fraction of dominant landcover type [%]:

77.0


Radius: 20 km

Number of landcover classes:

4

Dominant landcover type:

70: Tree cover, needleleaved, evergreen, closed to open (>15%)

Fraction of dominant landcover type [%]:

80.0


Disturbances


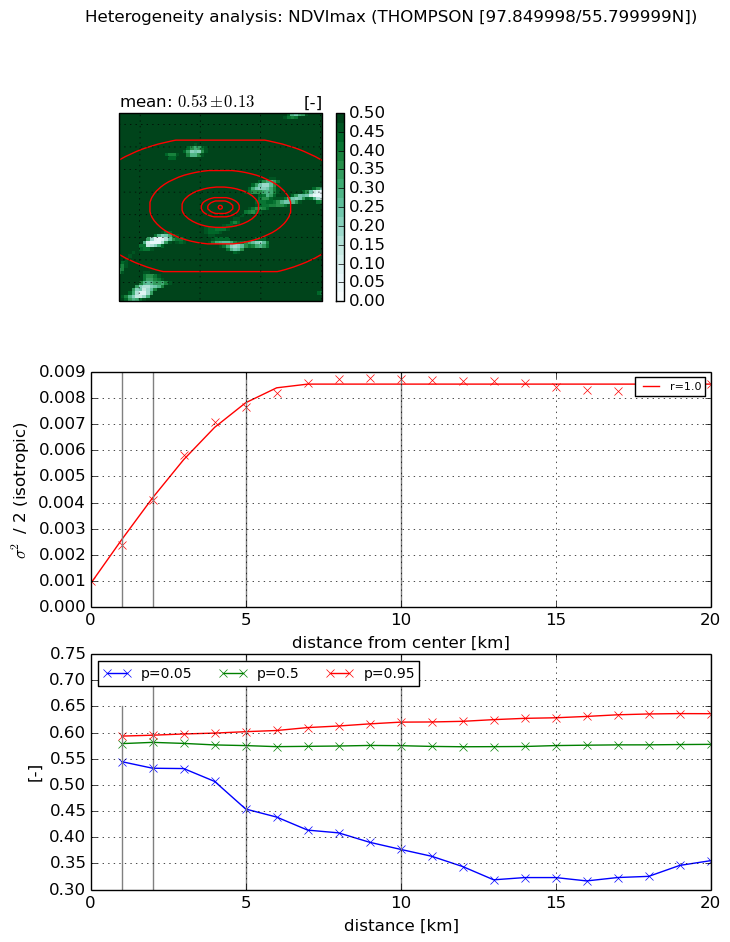
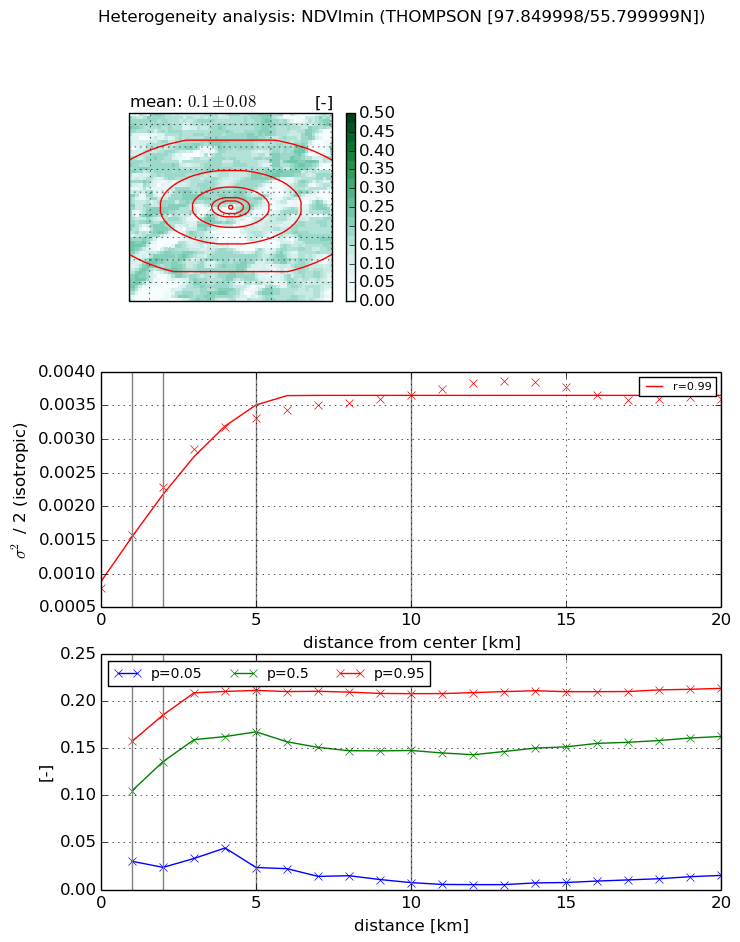
Heterogeneity analysis

The heterogeneity analysis provides information about the spatial and temporal heterogeneity of the site.

Topography


Roman et al. (2009) index


St

1.90376761706

Rcv

0.506645008596

Rse

0.0

Rst

-0.0692120827214

Rsv

-0.999965489714


Height range @ 1km [m]

20

Height range @ 2km [m]

26

Height range @ 5km [m]

49

Height range @ 10km [m]

-999

Height range @ 20km [m]

-999


Variance slope @ 1 km

71

Variance slope @ 2 km

60

Variance slope @ 5 km

37

Variance slope @ 10 km

-999

Variance slope @ 20 km

-999


NDVI (max. NDVI composite)


Roman et al. (2009) index


St

1.17337223388

Rcv

1.3479597362

Rse

0.0

Rst

-0.208773692343

Rsv

-0.999999987659


NDVI range @ 1km [-]

0.05

NDVI range @ 2km [-]

0.06

NDVI range @ 5km [-]

0.15

NDVI range @ 10km [-]

0.24

NDVI range @ 20km [-]

0.28


Variance slope @ 1 km

0.00139126112228

Variance slope @ 2 km

0.00155407288436

Variance slope @ 5 km

0.00140217258762

Variance slope @ 10 km

0.000768709694897

Variance slope @ 20 km

0.000250878904402


NDVI (min. NDVI composite)I


Roman et al. (2009) index


St

3.80120558159

Rcv

0.0789567212456

Rse

0.0

Rst

-0.183080430526

Rsv

0.527186144787


NDVI range @ 1km [-]

0.13

NDVI range @ 2km [-]

0.16

NDVI range @ 5km [-]

0.19

NDVI range @ 10km [-]

0.2

NDVI range @ 20km [-]

0.2


NDVI slope @ 1 km

0.000780293291923

NDVI slope @ 2 km

0.0007482132848

NDVI slope @ 5 km

0.000514571978114

NDVI slope @ 10 km

0.000252293337722

NDVI slope @ 20 km

9.20984998885e-05


Temporal stability analysis

+000 deg (BHR)


BHR statistics

Temporal stability [1/decade]:


abs

rel


Weighted least square:

None


Ordinary least square:

None


Probabilities that GCOS criteria is met:

Weighted least square:

None %

Ordinary least square:

None %


DHR statistics

Temporal stability [1/decade]:


abs

rel


Weighted least square:

None


Ordinary least square:

None


Probabilities that GCOS criteria is met:

Weighted least square:

None %

Ordinary least square:

None %


+057/+063 deg (BHR)


BHR statistics

Temporal stability [1/decade]:


abs

rel


Weighted least square:

None


Ordinary least square:

None


Probabilities that GCOS criteria is met:

Weighted least square:

None %

Ordinary least square:

None %


DHR statistics

Temporal stability [1/decade]:


abs

rel


Weighted least square:

None


Ordinary least square:

None


Probabilities that GCOS criteria is met:

Weighted least square:

None %

Ordinary least square:

None %


Temporal anomaly analyis

The variance of the temporal anomalies provides an additional measure about the stability of the signal AFTER removal of the mean seasonal cylce.

+000 deg


+057/+063 deg