TIMISOARA


Location

lon / lat [deg]: 21.2274 / 45.7463

Source network: AERONET


Geostationary surface albedo (GSA) data


“+000”


“+057/+063”


Landcover information (based on ESA CCI landcover data)


Landcover fractions @ 2km distance


Landcover fractions @ 20 km distance


Legend


Distance to open water bodies [km]:

4.76

Distance to urban areas [km]:

0.09


Radius: 1 km

Number of landcover classes:

1

Dominant landcover type:

190: urban areas

Fraction of dominant landcover type [%]:

100.0


Radius: 2 km

Number of landcover classes:

1

Dominant landcover type:

190: urban areas

Fraction of dominant landcover type [%]:

100.0


Radius: 5 km

Number of landcover classes:

2

Dominant landcover type:

190: urban areas

Fraction of dominant landcover type [%]:

79.0


Radius: 10 km

Number of landcover classes:

3

Dominant landcover type:

10: cropland, rainfed

Fraction of dominant landcover type [%]:

63.0


Radius: 20 km

Number of landcover classes:

4

Dominant landcover type:

10: cropland, rainfed

Fraction of dominant landcover type [%]:

81.0


Disturbances


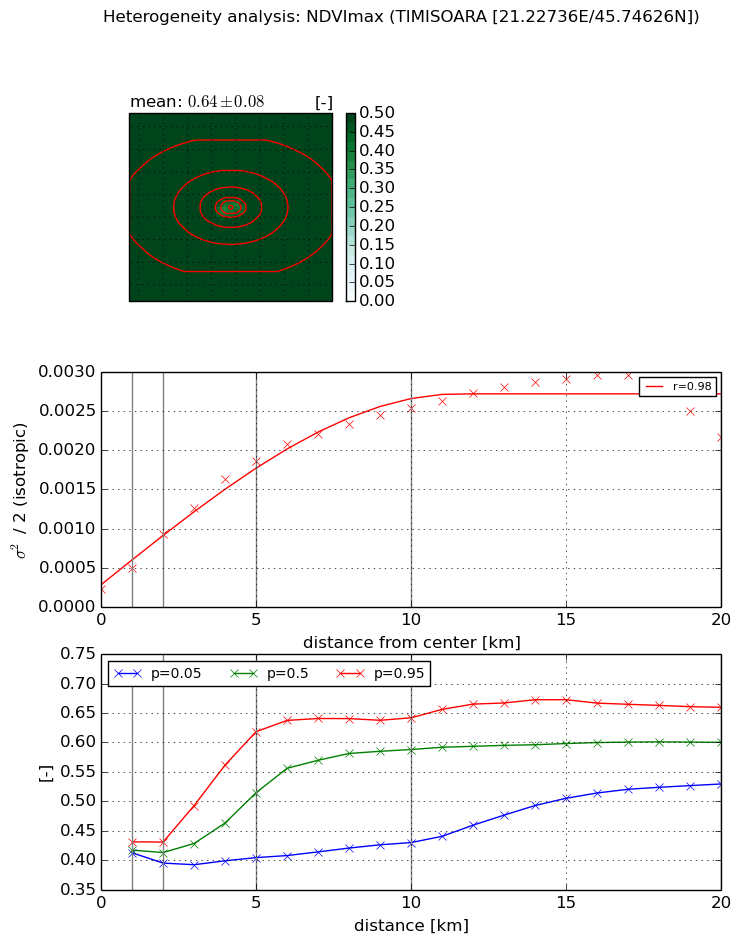
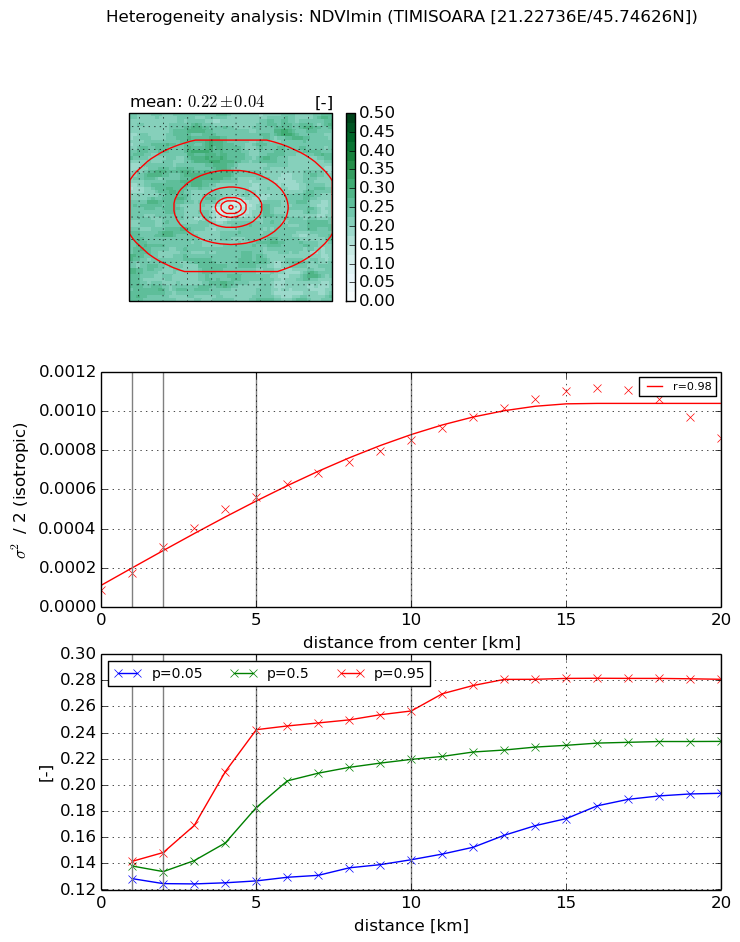
Heterogeneity analysis

The heterogeneity analysis provides information about the spatial and temporal heterogeneity of the site.

Topography


Roman et al. (2009) index


St

2.50967322825

Rcv

0.481389376779

Rse

0.0

Rst

0.0932029689251

Rsv

-0.620782401188


Height range @ 1km [m]

7

Height range @ 2km [m]

6

Height range @ 5km [m]

9

Height range @ 10km [m]

-999

Height range @ 20km [m]

-999


Variance slope @ 1 km

2

Variance slope @ 2 km

2

Variance slope @ 5 km

2

Variance slope @ 10 km

-999

Variance slope @ 20 km

-999


NDVI (max. NDVI composite)


Roman et al. (2009) index


St

1.84098663073e-07

Rcv

1.05632390954

Rse

0.0

Rst

0.428167904471

Rsv

16295608.4343


NDVI range @ 1km [-]

0.02

NDVI range @ 2km [-]

0.04

NDVI range @ 5km [-]

0.21

NDVI range @ 10km [-]

0.21

NDVI range @ 20km [-]

0.13


Variance slope @ 1 km

0.000269060596469

Variance slope @ 2 km

0.000349855695978

Variance slope @ 5 km

0.000338674480756

Variance slope @ 10 km

0.000235164379969

Variance slope @ 20 km

0.000107972468002


NDVI (min. NDVI composite)I


Roman et al. (2009) index


St

2.70193972355

Rcv

1.04284187572

Rse

0.0

Rst

0.0345224829527

Rsv

0.0329490853501


NDVI range @ 1km [-]

0.01

NDVI range @ 2km [-]

0.02

NDVI range @ 5km [-]

0.12

NDVI range @ 10km [-]

0.11

NDVI range @ 20km [-]

0.09


NDVI slope @ 1 km

8.86476615953e-05

NDVI slope @ 2 km

0.000110302876502

NDVI slope @ 5 km

9.81718516658e-05

NDVI slope @ 10 km

7.54727297731e-05

NDVI slope @ 20 km

4.63048225612e-05


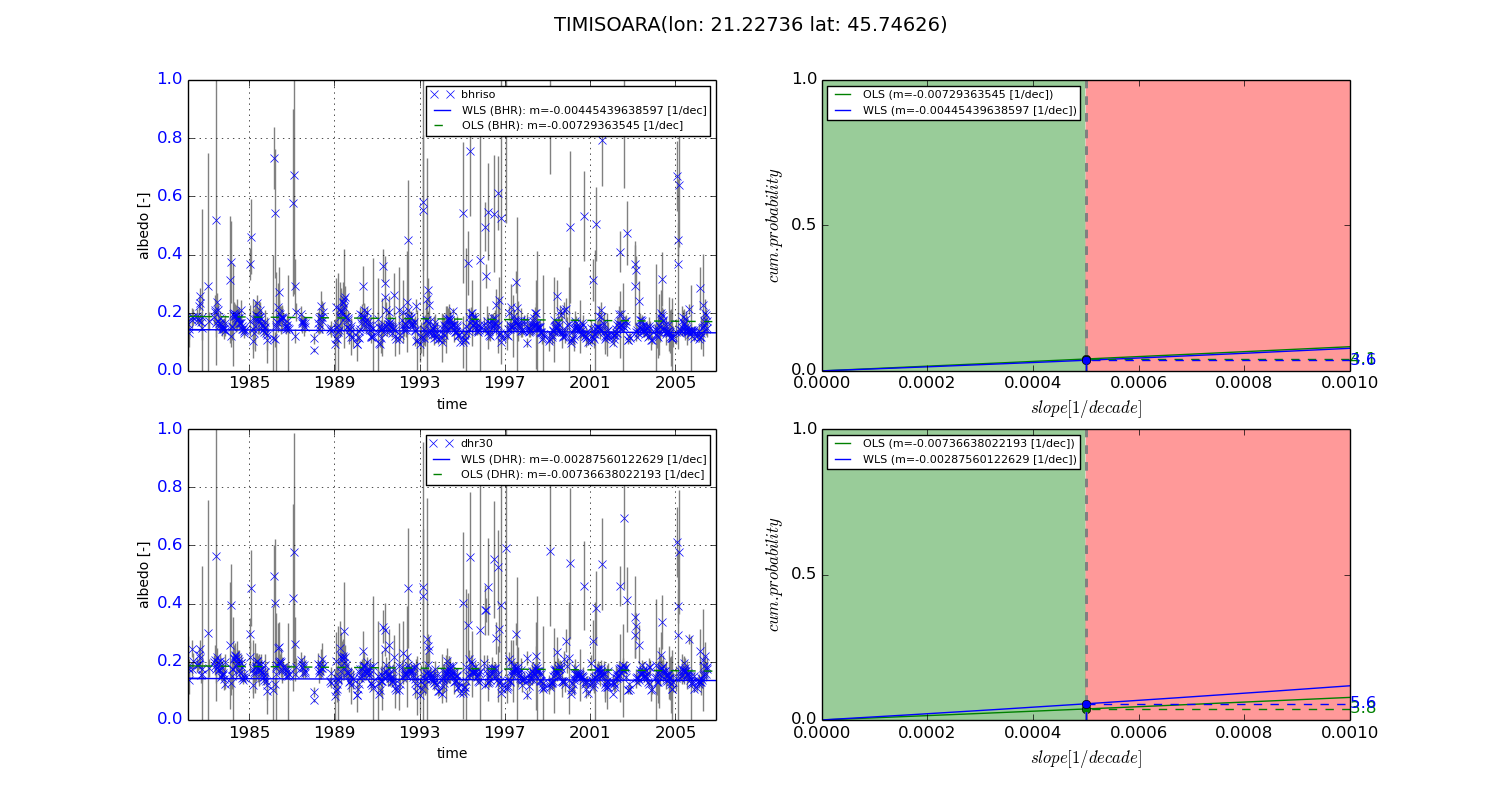
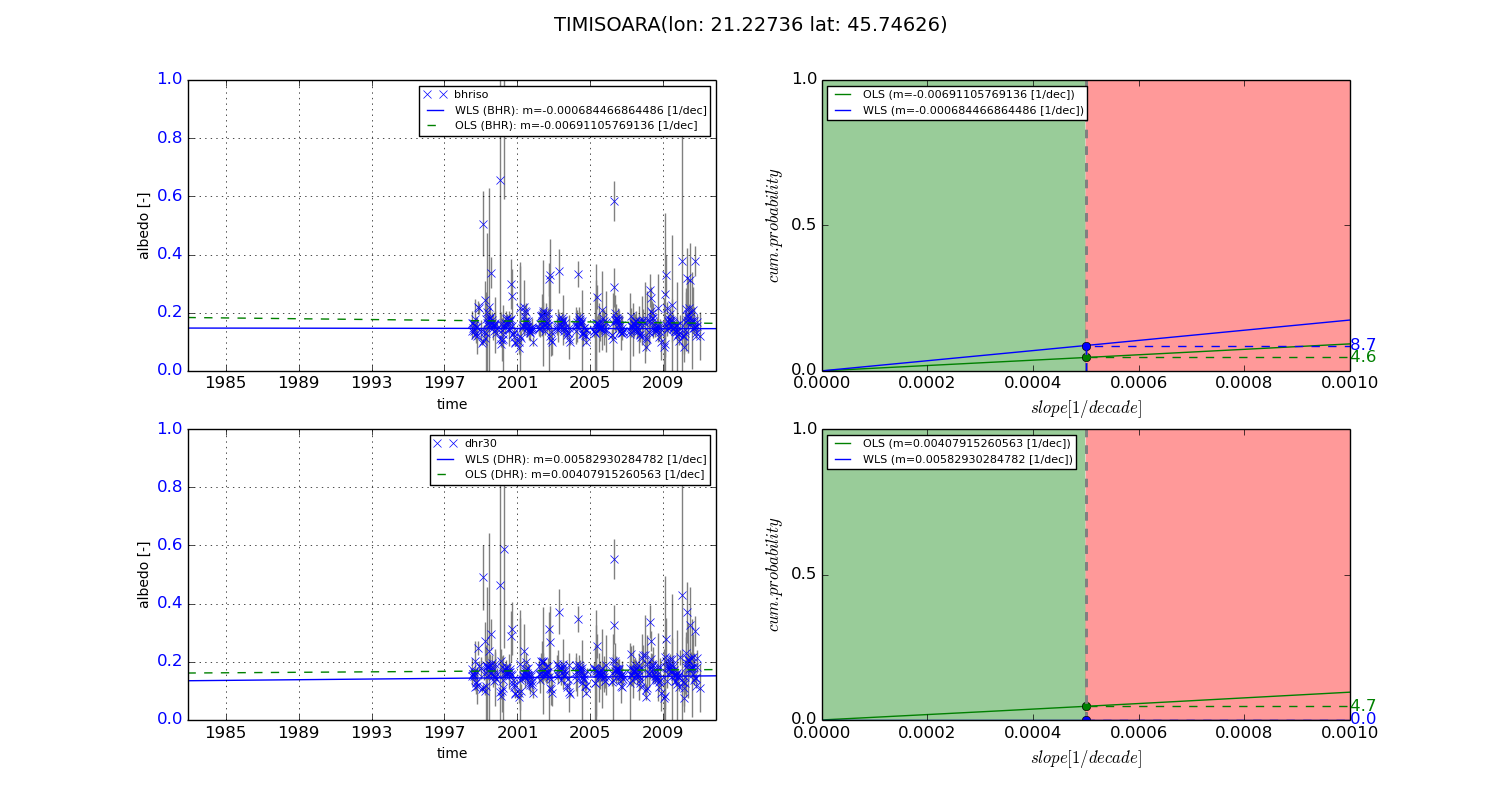
Temporal stability analysis

+000 deg (BHR)


BHR statistics

Temporal stability [1/decade]:


abs

rel


Weighted least square:

-0.00445439638597


Ordinary least square:

-0.00729363545


Probabilities that GCOS criteria is met:

Weighted least square:

3.6 %

Ordinary least square:

4.1 %


DHR statistics

Temporal stability [1/decade]:


abs

rel


Weighted least square:

-0.00287560122629


Ordinary least square:

-0.00736638022193


Probabilities that GCOS criteria is met:

Weighted least square:

5.6 %

Ordinary least square:

3.8 %


+057/+063 deg (BHR)


BHR statistics

Temporal stability [1/decade]:


abs

rel


Weighted least square:

-0.000684466864486


Ordinary least square:

-0.00691105769136


Probabilities that GCOS criteria is met:

Weighted least square:

8.7 %

Ordinary least square:

4.6 %


DHR statistics

Temporal stability [1/decade]:


abs

rel


Weighted least square:

0.00582930284782


Ordinary least square:

0.00407915260563


Probabilities that GCOS criteria is met:

Weighted least square:

0.0 %

Ordinary least square:

4.7 %


Temporal anomaly analyis

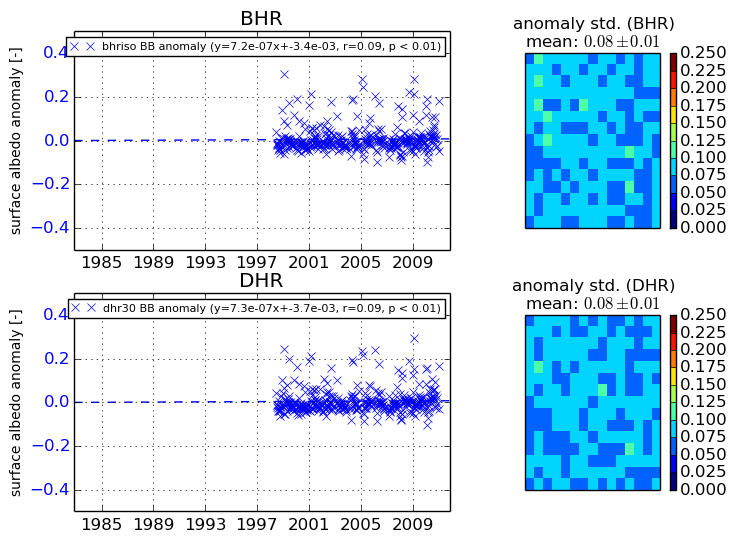
The variance of the temporal anomalies provides an additional measure about the stability of the signal AFTER removal of the mean seasonal cylce.
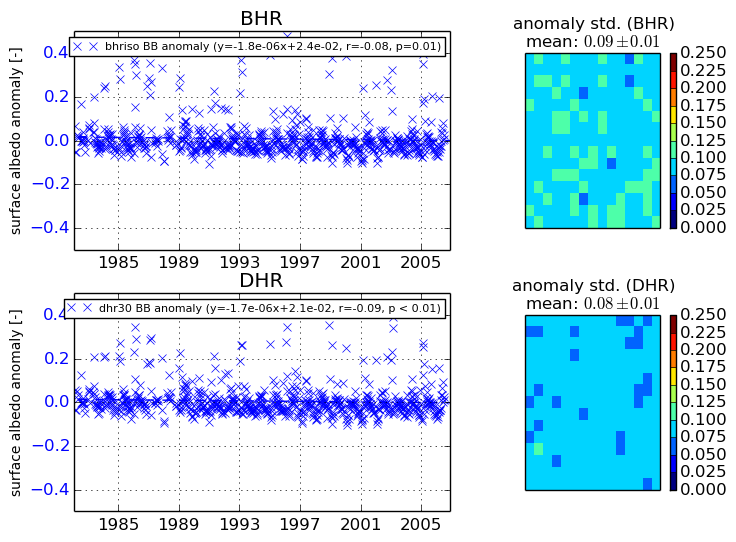
+000 deg


+057/+063 deg