TOMBSTONE


Location

lon / lat [deg]: -110.05 / 31.742

Source network: AERONET


Geostationary surface albedo (GSA) data


“+000”


“+057/+063”


Landcover information (based on ESA CCI landcover data)


Landcover fractions @ 2km distance


Landcover fractions @ 20 km distance


Legend


Distance to open water bodies [km]:

24.49

Distance to urban areas [km]:

1.3


Radius: 1 km

Number of landcover classes:

1

Dominant landcover type:

120: Shrubland

Fraction of dominant landcover type [%]:

100.0


Radius: 2 km

Number of landcover classes:

1

Dominant landcover type:

120: Shrubland

Fraction of dominant landcover type [%]:

99.0


Radius: 5 km

Number of landcover classes:

2

Dominant landcover type:

120: Shrubland

Fraction of dominant landcover type [%]:

97.0


Radius: 10 km

Number of landcover classes:

1

Dominant landcover type:

120: Shrubland

Fraction of dominant landcover type [%]:

99.0


Radius: 20 km

Number of landcover classes:

3

Dominant landcover type:

120: Shrubland

Fraction of dominant landcover type [%]:

96.0


Disturbances


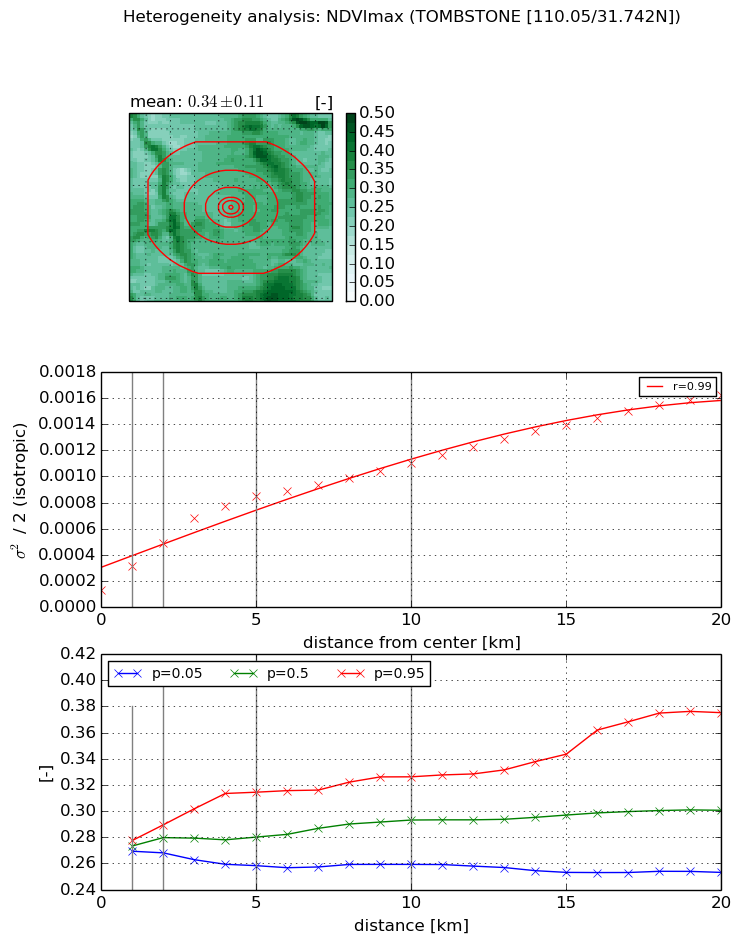
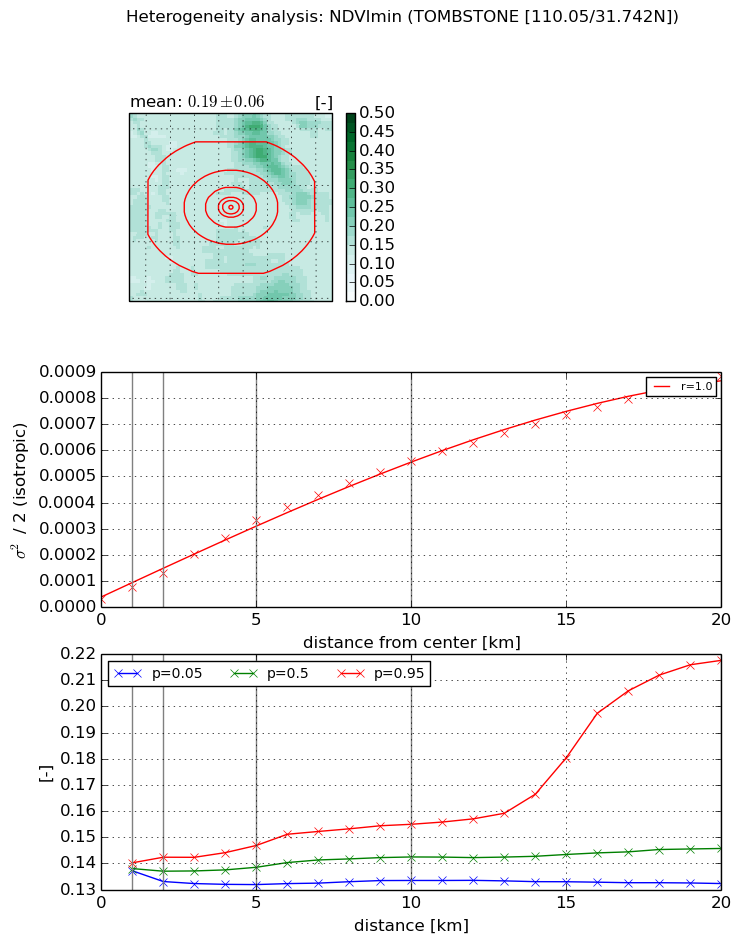
Heterogeneity analysis

The heterogeneity analysis provides information about the spatial and temporal heterogeneity of the site.

Topography


Roman et al. (2009) index


St

2.43094401201

Rcv

0.530934411714

Rse

0.0

Rst

-1.98573005043e-06

Rsv

-0.70315208225


Height range @ 1km [m]

33

Height range @ 2km [m]

56

Height range @ 5km [m]

120

Height range @ 10km [m]

-999

Height range @ 20km [m]

-999


Variance slope @ 1 km

152

Variance slope @ 2 km

191

Variance slope @ 5 km

319

Variance slope @ 10 km

-999

Variance slope @ 20 km

-999


NDVI (max. NDVI composite)


Roman et al. (2009) index


St

1.6708394089e-07

Rcv

0.507162901529

Rse

0.0

Rst

0.138802613711

Rsv

17955046.2845


NDVI range @ 1km [-]

0.01

NDVI range @ 2km [-]

0.02

NDVI range @ 5km [-]

0.06

NDVI range @ 10km [-]

0.07

NDVI range @ 20km [-]

0.12


Variance slope @ 1 km

0.000184180175618

Variance slope @ 2 km

0.000178840644029

Variance slope @ 5 km

0.000147179038534

Variance slope @ 10 km

8.9594804768e-05

Variance slope @ 20 km

6.59658260958e-05


NDVI (min. NDVI composite)I


Roman et al. (2009) index


St

3.31764755924

Rcv

0.680188213735

Rse

0.0

Rst

-5.93276477857e-09

Rsv

0.224066963087


NDVI range @ 1km [-]

0.0

NDVI range @ 2km [-]

0.01

NDVI range @ 5km [-]

0.01

NDVI range @ 10km [-]

0.02

NDVI range @ 20km [-]

0.09


NDVI slope @ 1 km

4.54173565353e-05

NDVI slope @ 2 km

4.95967483116e-05

NDVI slope @ 5 km

6.18151301567e-05

NDVI slope @ 10 km

5.47264735895e-05

NDVI slope @ 20 km

4.25181496729e-05


Temporal stability analysis

+000 deg (BHR)


BHR statistics

Temporal stability [1/decade]:


abs

rel


Weighted least square:

None


Ordinary least square:

None


Probabilities that GCOS criteria is met:

Weighted least square:

None %

Ordinary least square:

None %


DHR statistics

Temporal stability [1/decade]:


abs

rel


Weighted least square:

None


Ordinary least square:

None


Probabilities that GCOS criteria is met:

Weighted least square:

None %

Ordinary least square:

None %


+057/+063 deg (BHR)


BHR statistics

Temporal stability [1/decade]:


abs

rel


Weighted least square:

None


Ordinary least square:

None


Probabilities that GCOS criteria is met:

Weighted least square:

None %

Ordinary least square:

None %


DHR statistics

Temporal stability [1/decade]:


abs

rel


Weighted least square:

None


Ordinary least square:

None


Probabilities that GCOS criteria is met:

Weighted least square:

None %

Ordinary least square:

None %


Temporal anomaly analyis

The variance of the temporal anomalies provides an additional measure about the stability of the signal AFTER removal of the mean seasonal cylce.

+000 deg


+057/+063 deg