TOMSK_00022


Location

lon / lat [deg]: 84.074 / 56.417

Source network: AERONET


Geostationary surface albedo (GSA) data


“+000”


“+057/+063”


Landcover information (based on ESA CCI landcover data)


Landcover fractions @ 2km distance


Landcover fractions @ 20 km distance


Legend


Distance to open water bodies [km]:

0.23

Distance to urban areas [km]:

14.06


Radius: 1 km

Number of landcover classes:

4

Dominant landcover type:

60: Tree cover, broadleaved, decidous

Fraction of dominant landcover type [%]:

50.0


Radius: 2 km

Number of landcover classes:

5

Dominant landcover type:

210: water bodies

Fraction of dominant landcover type [%]:

44.0


Radius: 5 km

Number of landcover classes:

9

Dominant landcover type:

60: Tree cover, broadleaved, decidous

Fraction of dominant landcover type [%]:

41.0


Radius: 10 km

Number of landcover classes:

9

Dominant landcover type:

60: Tree cover, broadleaved, decidous

Fraction of dominant landcover type [%]:

44.0


Radius: 20 km

Number of landcover classes:

9

Dominant landcover type:

60: Tree cover, broadleaved, decidous

Fraction of dominant landcover type [%]:

42.0


Disturbances


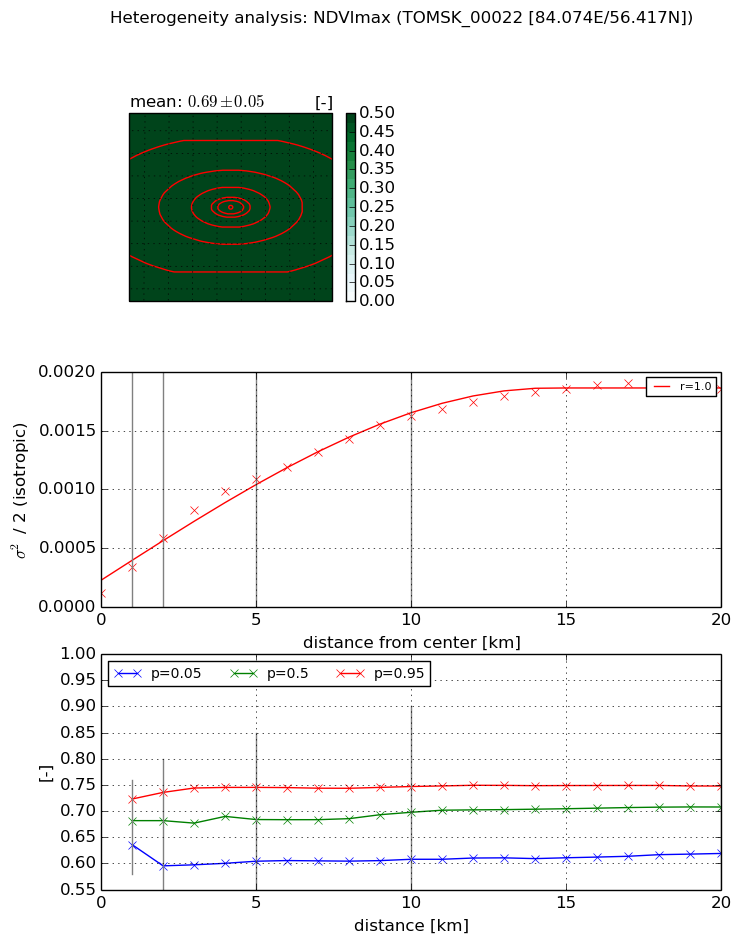
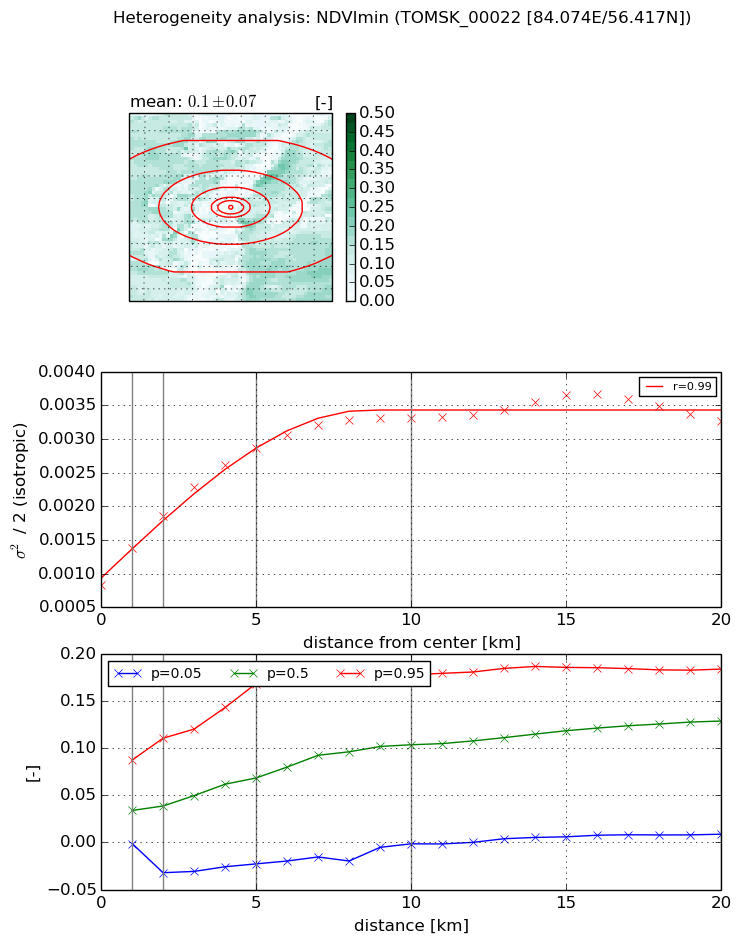
Heterogeneity analysis

The heterogeneity analysis provides information about the spatial and temporal heterogeneity of the site.

Topography


Roman et al. (2009) index


St

0.956609159699

Rcv

1.8878636312

Rse

0.0

Rst

0.248213545402

Rsv

-0.999999840412


Height range @ 1km [m]

19

Height range @ 2km [m]

17

Height range @ 5km [m]

67

Height range @ 10km [m]

-999

Height range @ 20km [m]

-999


Variance slope @ 1 km

62

Variance slope @ 2 km

75

Variance slope @ 5 km

92

Variance slope @ 10 km

-999

Variance slope @ 20 km

-999


NDVI (max. NDVI composite)


Roman et al. (2009) index


St

8.70675994411

Rcv

-0.183921567968

Rse

0.0

Rst

-0.0260924600834

Rsv

-0.134545833396


NDVI range @ 1km [-]

0.09

NDVI range @ 2km [-]

0.14

NDVI range @ 5km [-]

0.14

NDVI range @ 10km [-]

0.14

NDVI range @ 20km [-]

0.13


Variance slope @ 1 km

0.000221296635091

Variance slope @ 2 km

0.000234221120918

Variance slope @ 5 km

0.000199702916443

Variance slope @ 10 km

0.000145663506237

Variance slope @ 20 km

8.21846088986e-05


NDVI (min. NDVI composite)I


Roman et al. (2009) index


St

2.88384175066

Rcv

-0.221120528009

Rse

0.0

Rst

-0.124156313217

Rsv

0.695002154429


NDVI range @ 1km [-]

0.09

NDVI range @ 2km [-]

0.14

NDVI range @ 5km [-]

0.19

NDVI range @ 10km [-]

0.18

NDVI range @ 20km [-]

0.18


NDVI slope @ 1 km

0.000555386167134

NDVI slope @ 2 km

0.000514082940858

NDVI slope @ 5 km

0.00040950457135

NDVI slope @ 10 km

0.000243213208111

NDVI slope @ 20 km

0.000101202677439


Temporal stability analysis

+000 deg (BHR)


BHR statistics

Temporal stability [1/decade]:


abs

rel


Weighted least square:

None


Ordinary least square:

None


Probabilities that GCOS criteria is met:

Weighted least square:

None %

Ordinary least square:

None %


DHR statistics

Temporal stability [1/decade]:


abs

rel


Weighted least square:

None


Ordinary least square:

None


Probabilities that GCOS criteria is met:

Weighted least square:

None %

Ordinary least square:

None %


+057/+063 deg (BHR)


BHR statistics

Temporal stability [1/decade]:


abs

rel


Weighted least square:

-0.0172826101333


Ordinary least square:

-0.0626838493607


Probabilities that GCOS criteria is met:

Weighted least square:

3.7 %

Ordinary least square:

4.5 %


DHR statistics

Temporal stability [1/decade]:


abs

rel


Weighted least square:

-0.0132029475797


Ordinary least square:

-0.0717225515572


Probabilities that GCOS criteria is met:

Weighted least square:

3.9 %

Ordinary least square:

4.6 %


Temporal anomaly analyis

The variance of the temporal anomalies provides an additional measure about the stability of the signal AFTER removal of the mean seasonal cylce.

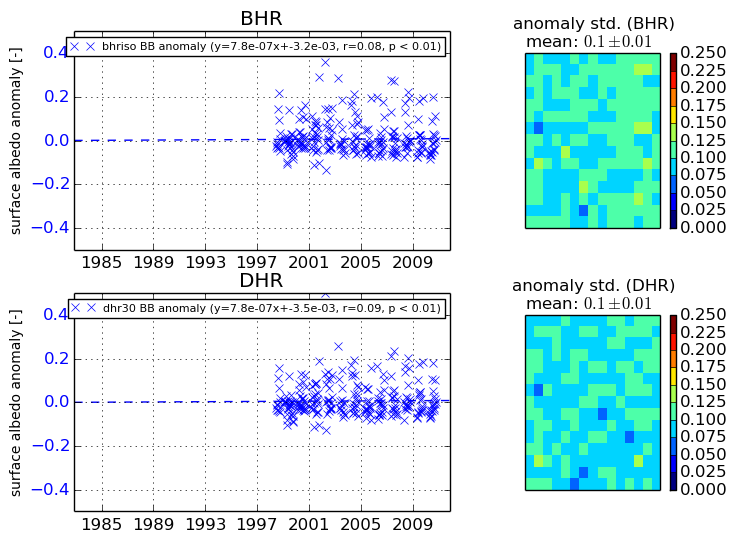
+000 deg


+057/+063 deg