TORAVERE


Location

lon / lat [deg]: 26.46 / 58.255

Source network: AERONET


Geostationary surface albedo (GSA) data


“+000”


“+057/+063”


Landcover information (based on ESA CCI landcover data)


Landcover fractions @ 2km distance


Landcover fractions @ 20 km distance


Legend


Distance to open water bodies [km]:

1.56

Distance to urban areas [km]:

1.68


Radius: 1 km

Number of landcover classes:

6

Dominant landcover type:

70: Tree cover, needleleaved, evergreen, closed to open (>15%)

Fraction of dominant landcover type [%]:

44.0


Radius: 2 km

Number of landcover classes:

8

Dominant landcover type:

10: cropland, rainfed

Fraction of dominant landcover type [%]:

47.0


Radius: 5 km

Number of landcover classes:

8

Dominant landcover type:

10: cropland, rainfed

Fraction of dominant landcover type [%]:

52.0


Radius: 10 km

Number of landcover classes:

8

Dominant landcover type:

10: cropland, rainfed

Fraction of dominant landcover type [%]:

52.0


Radius: 20 km

Number of landcover classes:

10

Dominant landcover type:

10: cropland, rainfed

Fraction of dominant landcover type [%]:

44.0


Disturbances


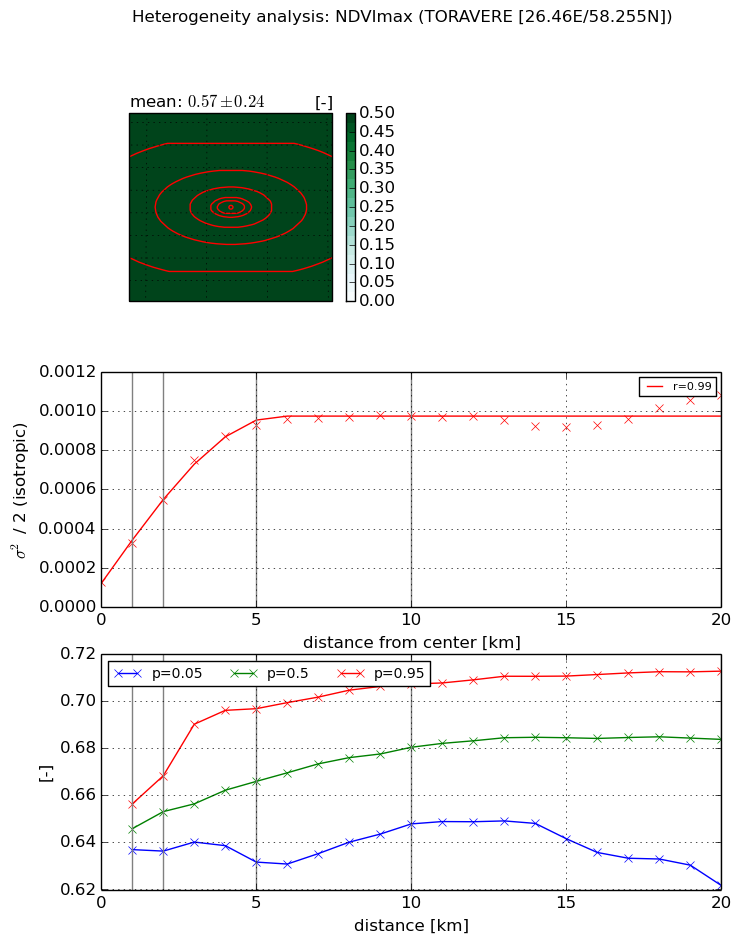
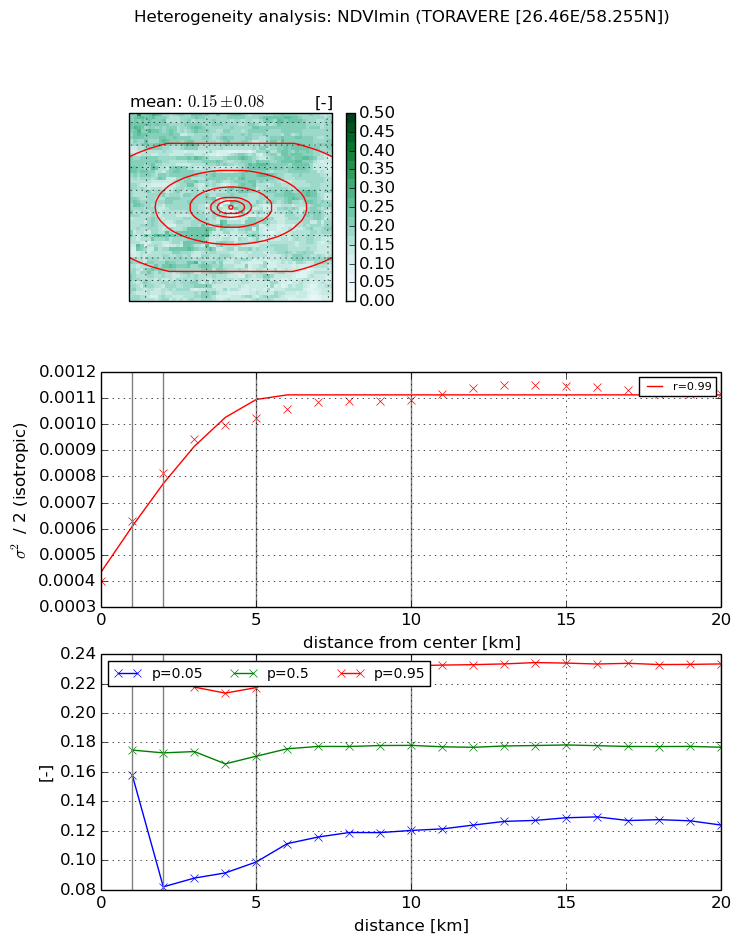
Heterogeneity analysis

The heterogeneity analysis provides information about the spatial and temporal heterogeneity of the site.

Topography


Roman et al. (2009) index


St

2.95884251636

Rcv

0.183897560811

Rse

0.0

Rst

0.739447632017

Rsv

-0.0905648018454


Height range @ 1km [m]

36

Height range @ 2km [m]

35

Height range @ 5km [m]

52

Height range @ 10km [m]

-999

Height range @ 20km [m]

-999


Variance slope @ 1 km

81

Variance slope @ 2 km

75

Variance slope @ 5 km

67

Variance slope @ 10 km

-999

Variance slope @ 20 km

-999


NDVI (max. NDVI composite)


Roman et al. (2009) index


St

2.43980837297

Rcv

0.324559084155

Rse

0.0

Rst

-0.0725071890778

Rsv

0.832538491322


NDVI range @ 1km [-]

0.02

NDVI range @ 2km [-]

0.03

NDVI range @ 5km [-]

0.07

NDVI range @ 10km [-]

0.06

NDVI range @ 20km [-]

0.09


Variance slope @ 1 km

0.00019777110128

Variance slope @ 2 km

0.000207580634072

Variance slope @ 5 km

0.000166681207761

Variance slope @ 10 km

7.84845944811e-05

Variance slope @ 20 km

2.78519069501e-05


NDVI (min. NDVI composite)I


Roman et al. (2009) index


St

8.51659820646

Rcv

-0.146812801442

Rse

0.0

Rst

-0.0267265933533

Rsv

0.178713925987


NDVI range @ 1km [-]

0.07

NDVI range @ 2km [-]

0.15

NDVI range @ 5km [-]

0.12

NDVI range @ 10km [-]

0.11

NDVI range @ 20km [-]

0.11


NDVI slope @ 1 km

0.000228218198967

NDVI slope @ 2 km

0.00020612818086

NDVI slope @ 5 km

0.000124708016094

NDVI slope @ 10 km

5.88968068896e-05

NDVI slope @ 20 km

2.26945100118e-05


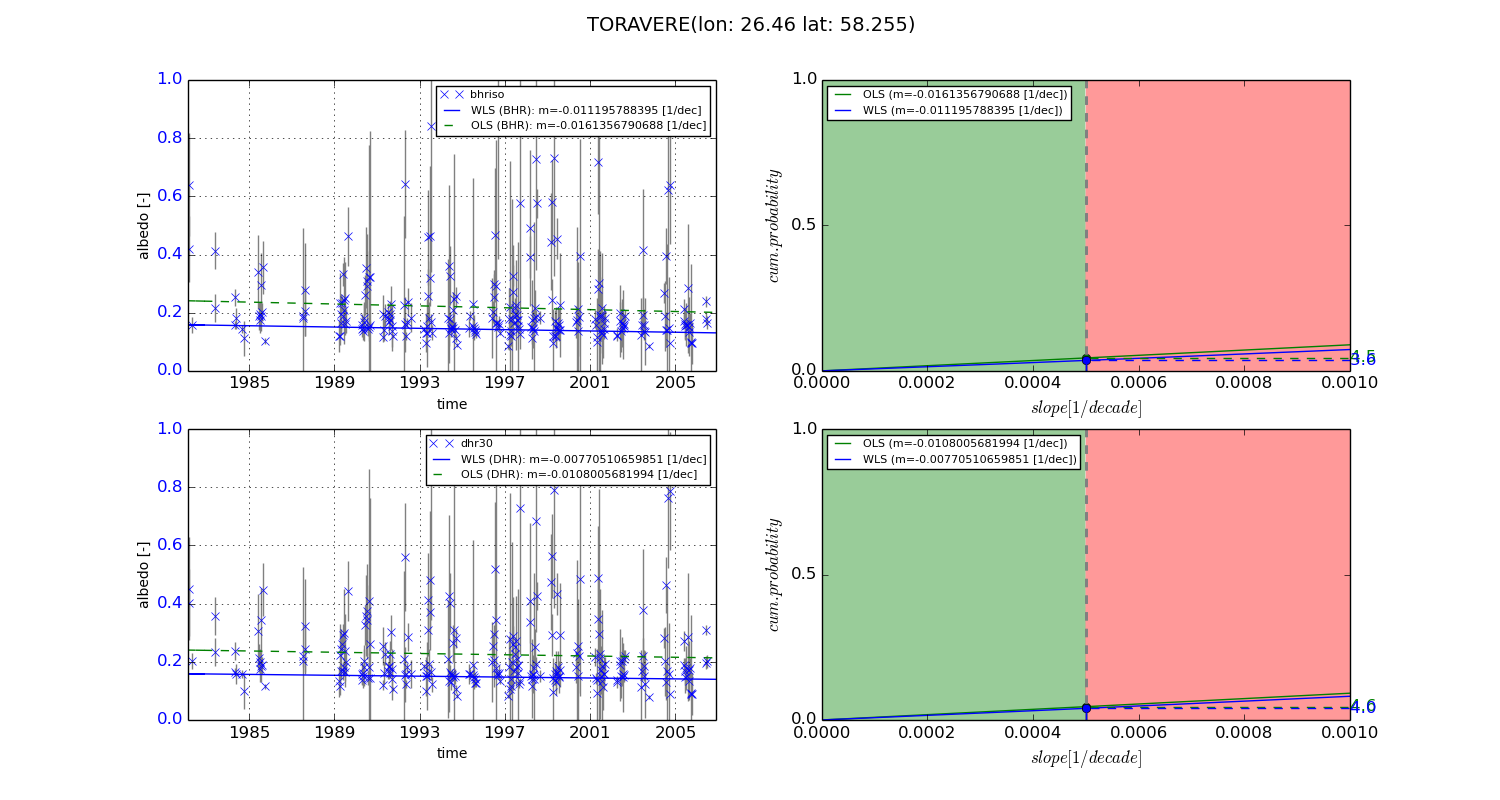
Temporal stability analysis

+000 deg (BHR)


BHR statistics

Temporal stability [1/decade]:


abs

rel


Weighted least square:

-0.011195788395


Ordinary least square:

-0.0161356790688


Probabilities that GCOS criteria is met:

Weighted least square:

3.6 %

Ordinary least square:

4.5 %


DHR statistics

Temporal stability [1/decade]:


abs

rel


Weighted least square:

-0.00770510659851


Ordinary least square:

-0.0108005681994


Probabilities that GCOS criteria is met:

Weighted least square:

4.0 %

Ordinary least square:

4.6 %


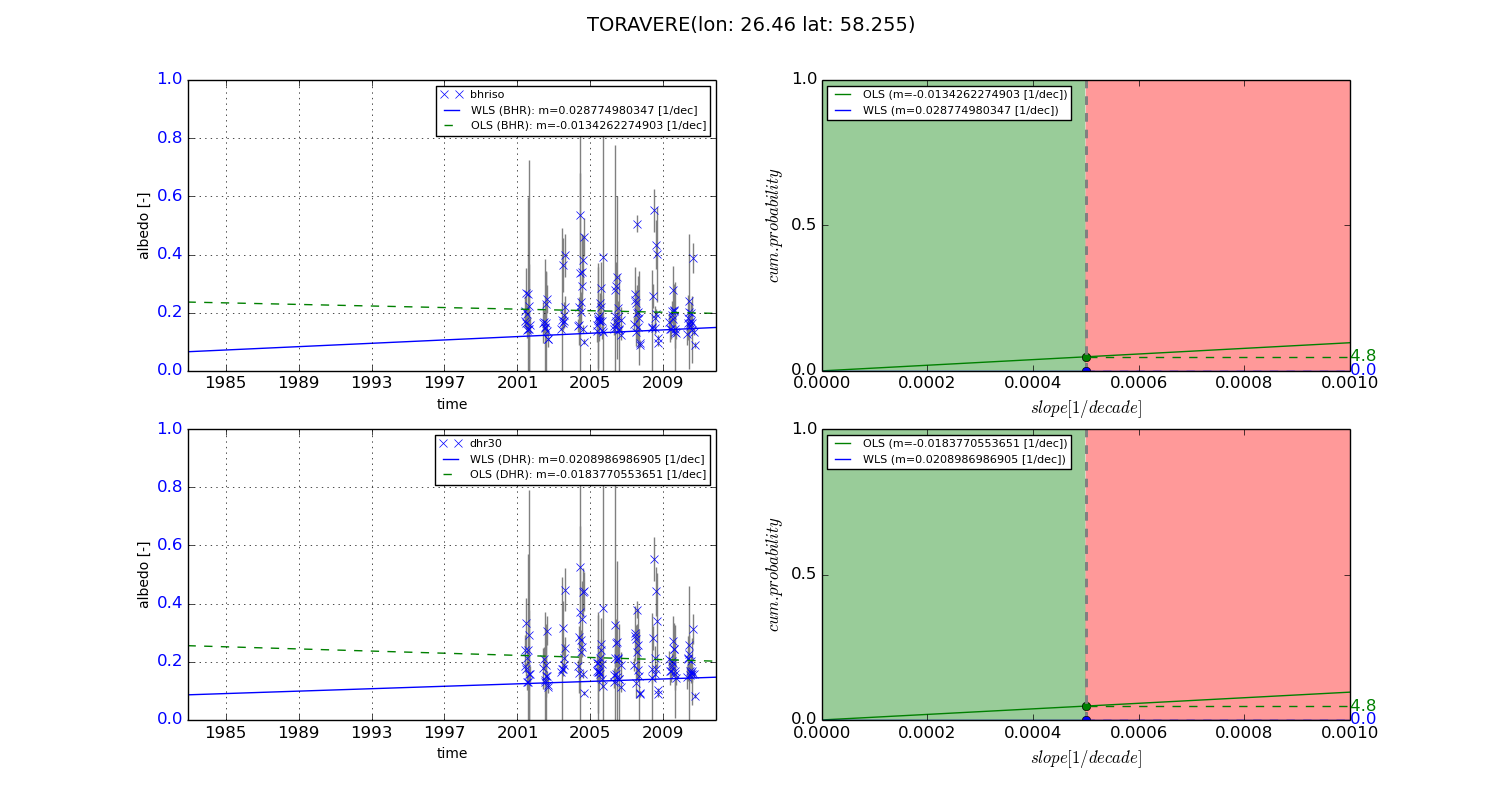
+057/+063 deg (BHR)


BHR statistics

Temporal stability [1/decade]:


abs

rel


Weighted least square:

0.028774980347


Ordinary least square:

-0.0134262274903


Probabilities that GCOS criteria is met:

Weighted least square:

0.0 %

Ordinary least square:

4.8 %


DHR statistics

Temporal stability [1/decade]:


abs

rel


Weighted least square:

0.0208986986905


Ordinary least square:

-0.0183770553651


Probabilities that GCOS criteria is met:

Weighted least square:

0.0 %

Ordinary least square:

4.8 %


Temporal anomaly analyis

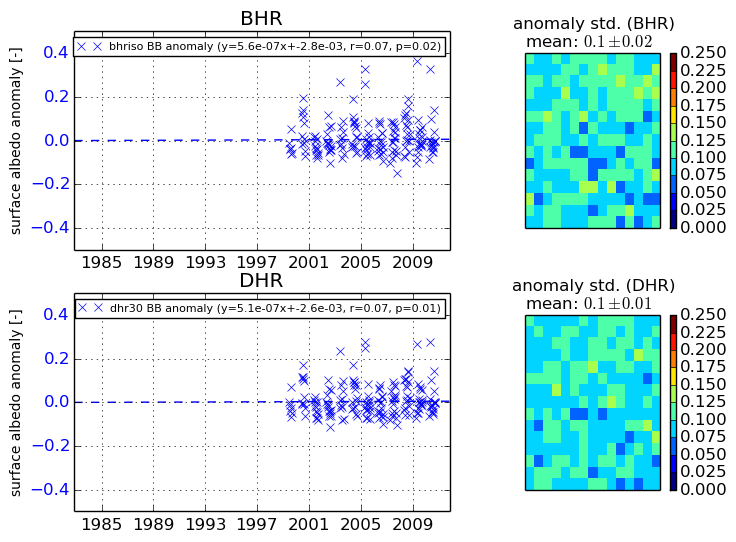
The variance of the temporal anomalies provides an additional measure about the stability of the signal AFTER removal of the mean seasonal cylce.
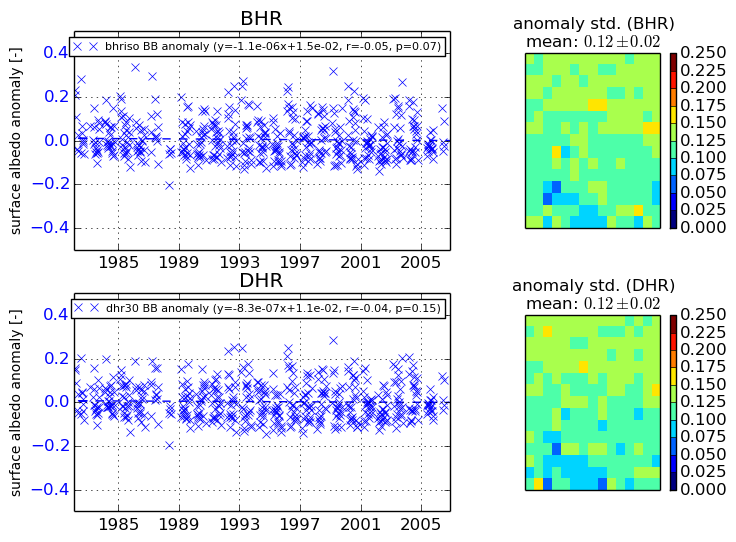
+000 deg


+057/+063 deg