TOULOUSE


Location

lon / lat [deg]: 1.3739 / 43.5747

Source network: AERONET


Geostationary surface albedo (GSA) data


“+000”


“+057/+063”


Landcover information (based on ESA CCI landcover data)


Landcover fractions @ 2km distance


Landcover fractions @ 20 km distance


Legend


Distance to open water bodies [km]:

0.71

Distance to urban areas [km]:

0.13


Radius: 1 km

Number of landcover classes:

3

Dominant landcover type:

190: urban areas

Fraction of dominant landcover type [%]:

66.0


Radius: 2 km

Number of landcover classes:

3

Dominant landcover type:

190: urban areas

Fraction of dominant landcover type [%]:

83.0


Radius: 5 km

Number of landcover classes:

3

Dominant landcover type:

190: urban areas

Fraction of dominant landcover type [%]:

88.0


Radius: 10 km

Number of landcover classes:

3

Dominant landcover type:

190: urban areas

Fraction of dominant landcover type [%]:

69.0


Radius: 20 km

Number of landcover classes:

3

Dominant landcover type:

10: cropland, rainfed

Fraction of dominant landcover type [%]:

63.0


Disturbances


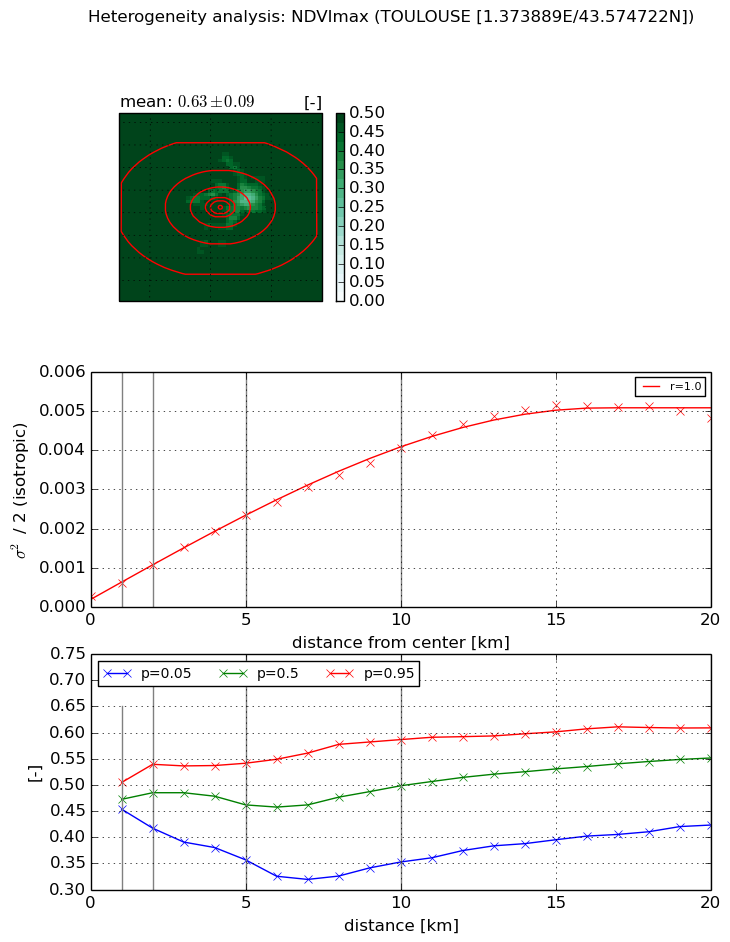
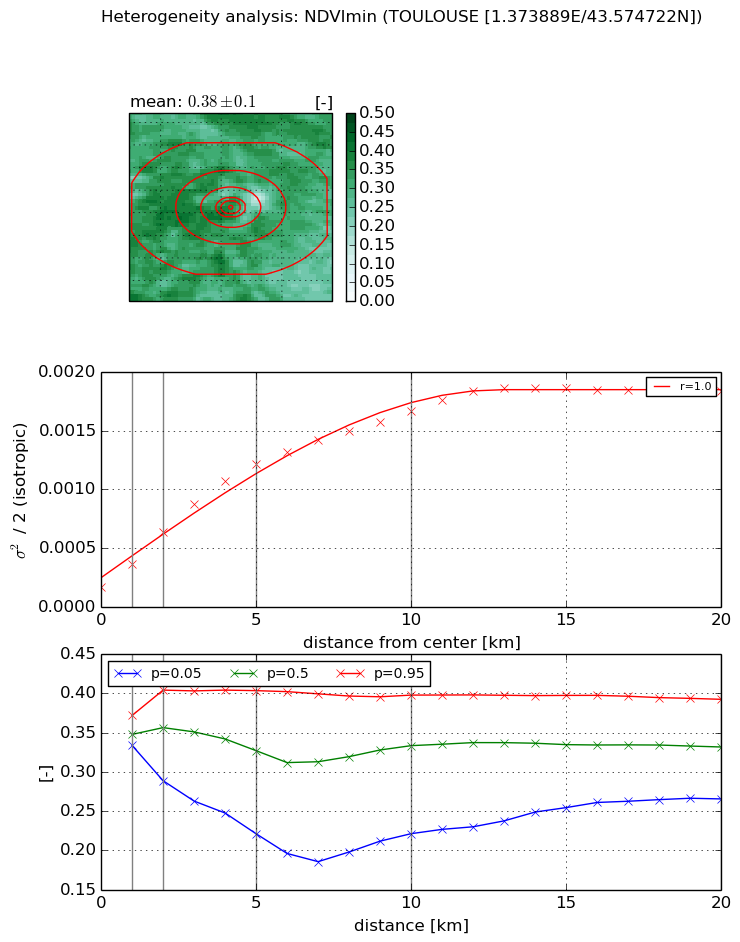
Heterogeneity analysis

The heterogeneity analysis provides information about the spatial and temporal heterogeneity of the site.

Topography


Roman et al. (2009) index


St

1.5684315886

Rcv

0.912808665648

Rse

0.0

Rst

-5.0576567648e-05

Rsv

-0.999879586696


Height range @ 1km [m]

7

Height range @ 2km [m]

11

Height range @ 5km [m]

38

Height range @ 10km [m]

-999

Height range @ 20km [m]

-999


Variance slope @ 1 km

36

Variance slope @ 2 km

29

Variance slope @ 5 km

24

Variance slope @ 10 km

-999

Variance slope @ 20 km

-999


NDVI (max. NDVI composite)


Roman et al. (2009) index


St

3.50218259303

Rcv

0.297516785109

Rse

0.0

Rst

-0.110284020298

Rsv

0.448807872269


NDVI range @ 1km [-]

0.05

NDVI range @ 2km [-]

0.12

NDVI range @ 5km [-]

0.18

NDVI range @ 10km [-]

0.23

NDVI range @ 20km [-]

0.19


Variance slope @ 1 km

0.000325242078141

Variance slope @ 2 km

0.00039884916983

Variance slope @ 5 km

0.000420664726903

Variance slope @ 10 km

0.000379342029392

Variance slope @ 20 km

0.000251435613218


NDVI (min. NDVI composite)I


Roman et al. (2009) index


St

2.12849011182

Rcv

0.413000029001

Rse

0.0

Rst

-0.0855989971857

Rsv

0.910850791472


NDVI range @ 1km [-]

0.04

NDVI range @ 2km [-]

0.12

NDVI range @ 5km [-]

0.18

NDVI range @ 10km [-]

0.18

NDVI range @ 20km [-]

0.13


NDVI slope @ 1 km

0.000195124010913

NDVI slope @ 2 km

0.0002310689371

NDVI slope @ 5 km

0.000215567636975

NDVI slope @ 10 km

0.000147560623273

NDVI slope @ 20 km

7.69309863066e-05


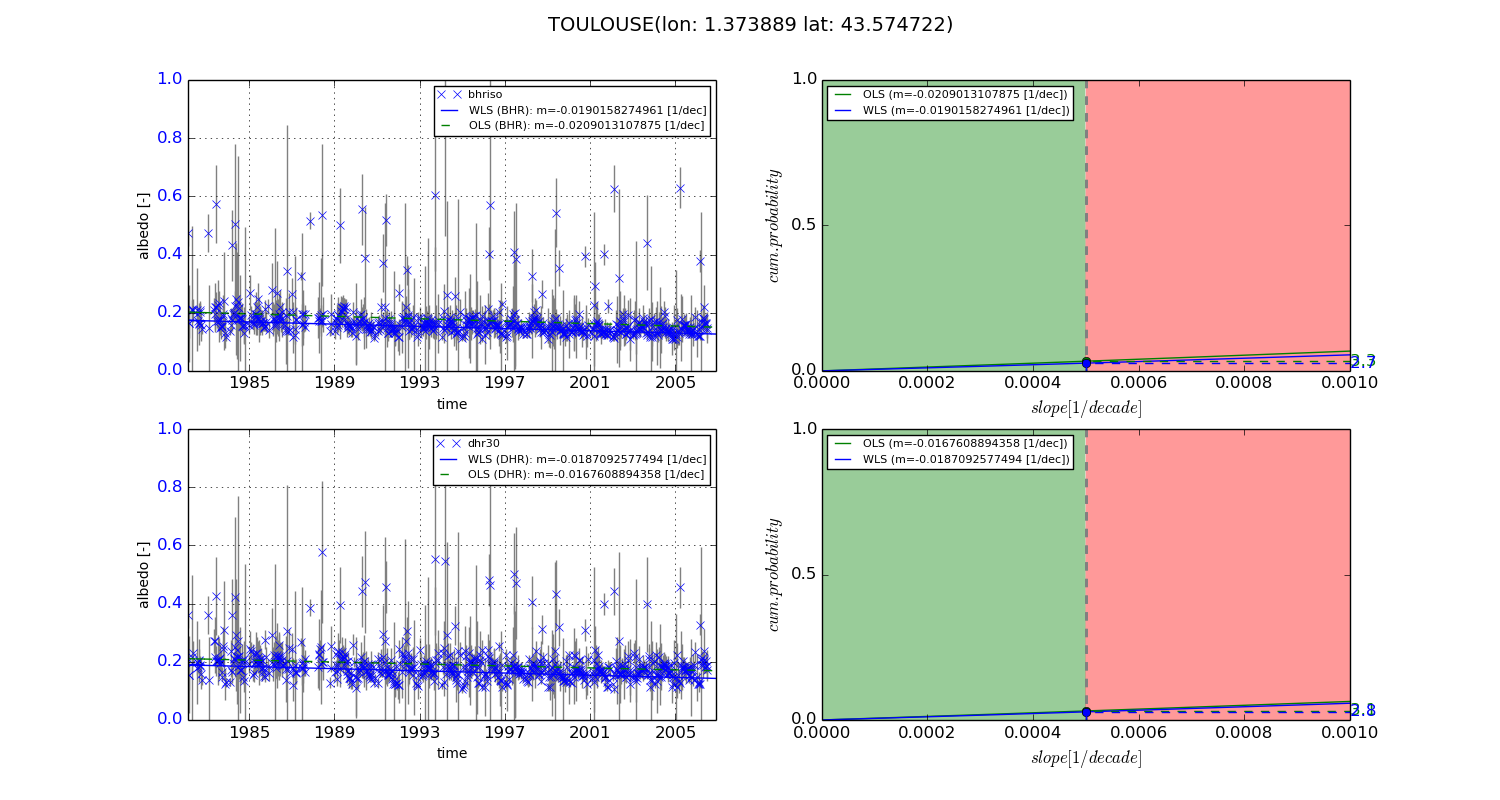
Temporal stability analysis

+000 deg (BHR)


BHR statistics

Temporal stability [1/decade]:


abs

rel


Weighted least square:

-0.0190158274961


Ordinary least square:

-0.0209013107875


Probabilities that GCOS criteria is met:

Weighted least square:

2.7 %

Ordinary least square:

3.3 %


DHR statistics

Temporal stability [1/decade]:


abs

rel


Weighted least square:

-0.0187092577494


Ordinary least square:

-0.0167608894358


Probabilities that GCOS criteria is met:

Weighted least square:

2.8 %

Ordinary least square:

3.1 %


+057/+063 deg (BHR)


BHR statistics

Temporal stability [1/decade]:


abs

rel


Weighted least square:

-99999.0


Ordinary least square:

-99999.0


Probabilities that GCOS criteria is met:

Weighted least square:

-99999.0 %

Ordinary least square:

-99999.0 %


DHR statistics

Temporal stability [1/decade]:


abs

rel


Weighted least square:

-99999.0


Ordinary least square:

-99999.0


Probabilities that GCOS criteria is met:

Weighted least square:

-99999.0 %

Ordinary least square:

-99999.0 %


Temporal anomaly analyis

The variance of the temporal anomalies provides an additional measure about the stability of the signal AFTER removal of the mean seasonal cylce.
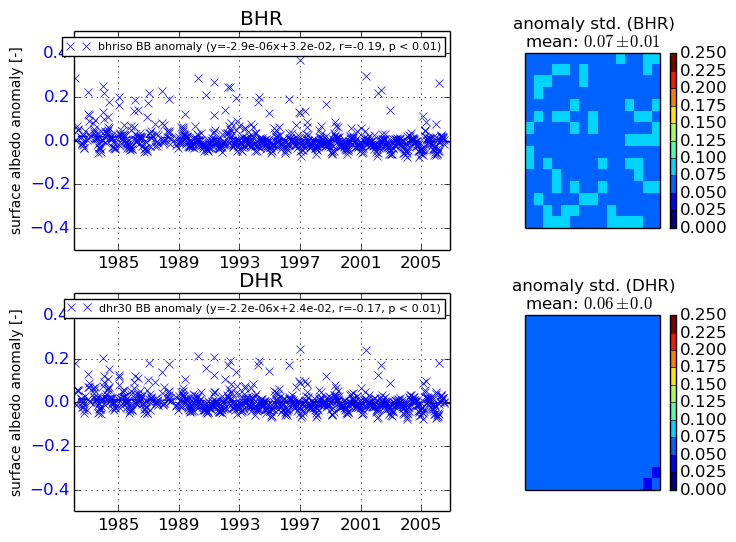
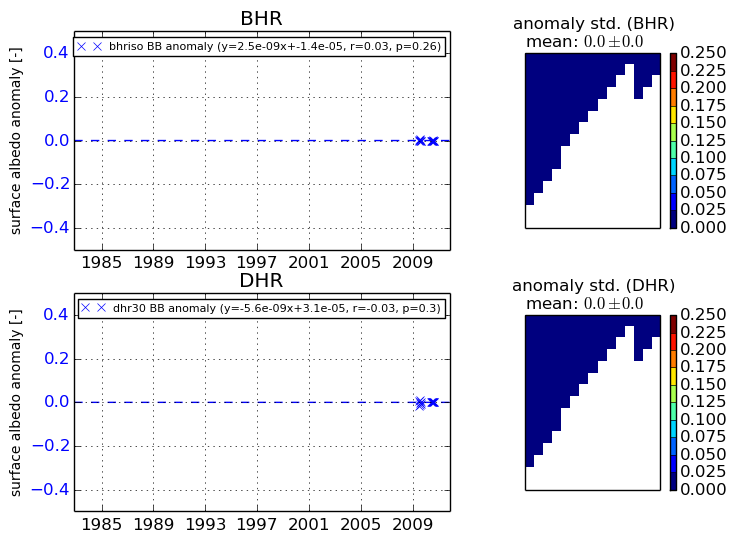
+000 deg


+057/+063 deg