TUCSON


Location

lon / lat [deg]: -110.953 / 32.233

Source network: AERONET


Geostationary surface albedo (GSA) data


“+000”


“+057/+063”


Landcover information (based on ESA CCI landcover data)


Landcover fractions @ 2km distance


Landcover fractions @ 20 km distance


Legend


Distance to open water bodies [km]:

14.78

Distance to urban areas [km]:

0.16


Radius: 1 km

Number of landcover classes:

1

Dominant landcover type:

190: urban areas

Fraction of dominant landcover type [%]:

100.0


Radius: 2 km

Number of landcover classes:

1

Dominant landcover type:

190: urban areas

Fraction of dominant landcover type [%]:

100.0


Radius: 5 km

Number of landcover classes:

1

Dominant landcover type:

190: urban areas

Fraction of dominant landcover type [%]:

100.0


Radius: 10 km

Number of landcover classes:

2

Dominant landcover type:

190: urban areas

Fraction of dominant landcover type [%]:

91.0


Radius: 20 km

Number of landcover classes:

3

Dominant landcover type:

190: urban areas

Fraction of dominant landcover type [%]:

51.0


Disturbances


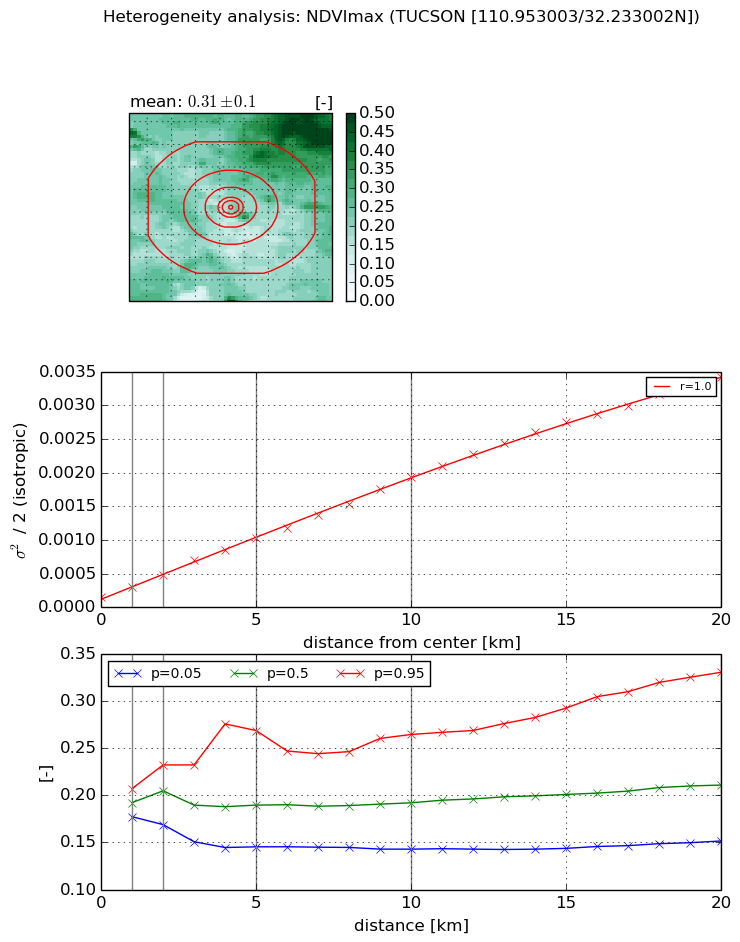
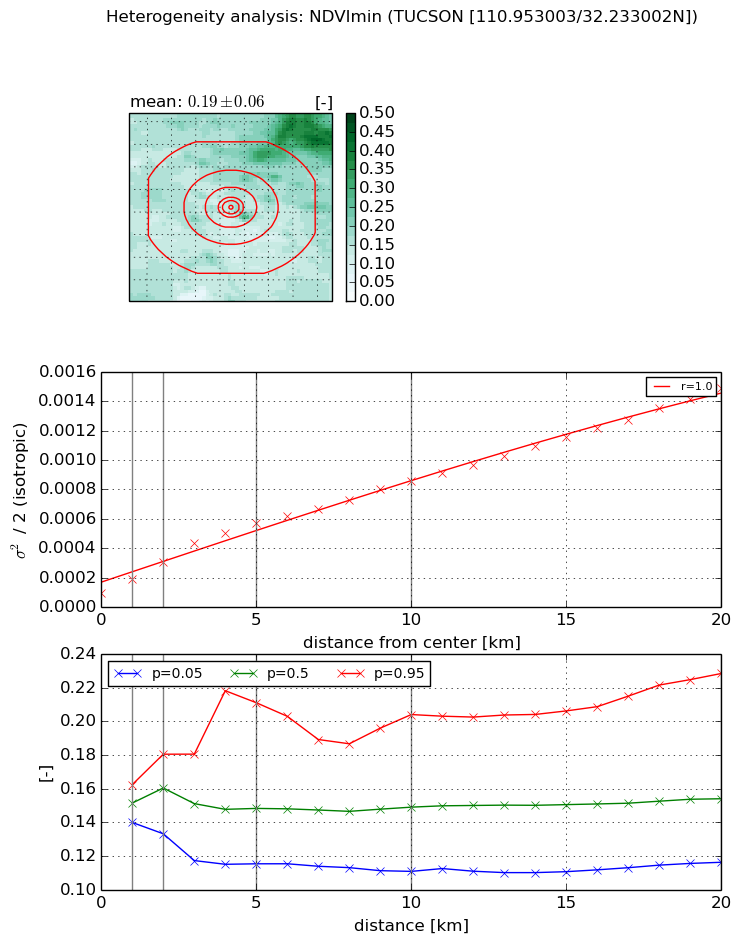
Heterogeneity analysis

The heterogeneity analysis provides information about the spatial and temporal heterogeneity of the site.

Topography


Roman et al. (2009) index


St

0.014664344984

Rcv

0.592850963531

Rse

0.0

Rst

2.51928864008e-05

Rsv

203.984962355


Height range @ 1km [m]

18

Height range @ 2km [m]

28

Height range @ 5km [m]

60

Height range @ 10km [m]

-999

Height range @ 20km [m]

-999


Variance slope @ 1 km

123

Variance slope @ 2 km

98

Variance slope @ 5 km

80

Variance slope @ 10 km

-999

Variance slope @ 20 km

-999


NDVI (max. NDVI composite)


Roman et al. (2009) index


St

5.85225753599

Rcv

0.308318249691

Rse

0.0

Rst

-0.027882120532

Rsv

-0.176422319662


NDVI range @ 1km [-]

0.03

NDVI range @ 2km [-]

0.06

NDVI range @ 5km [-]

0.12

NDVI range @ 10km [-]

0.12

NDVI range @ 20km [-]

0.18


Variance slope @ 1 km

0.000160250213699

Variance slope @ 2 km

0.000169841170148

Variance slope @ 5 km

0.000179172854631

Variance slope @ 10 km

0.000178128387761

Variance slope @ 20 km

0.000166880274636


NDVI (min. NDVI composite)I


Roman et al. (2009) index


St

4.58031688354

Rcv

0.43270999753

Rse

0.0

Rst

-0.0395575173981

Rsv

-0.182709002261


NDVI range @ 1km [-]

0.02

NDVI range @ 2km [-]

0.05

NDVI range @ 5km [-]

0.1

NDVI range @ 10km [-]

0.09

NDVI range @ 20km [-]

0.11


NDVI slope @ 1 km

0.000100580142394

NDVI slope @ 2 km

0.000107261232158

NDVI slope @ 5 km

9.90454422334e-05

NDVI slope @ 10 km

7.36995117094e-05

NDVI slope @ 20 km

6.4827442569e-05


Temporal stability analysis

+000 deg (BHR)


BHR statistics

Temporal stability [1/decade]:


abs

rel


Weighted least square:

None


Ordinary least square:

None


Probabilities that GCOS criteria is met:

Weighted least square:

None %

Ordinary least square:

None %


DHR statistics

Temporal stability [1/decade]:


abs

rel


Weighted least square:

None


Ordinary least square:

None


Probabilities that GCOS criteria is met:

Weighted least square:

None %

Ordinary least square:

None %


+057/+063 deg (BHR)


BHR statistics

Temporal stability [1/decade]:


abs

rel


Weighted least square:

None


Ordinary least square:

None


Probabilities that GCOS criteria is met:

Weighted least square:

None %

Ordinary least square:

None %


DHR statistics

Temporal stability [1/decade]:


abs

rel


Weighted least square:

None


Ordinary least square:

None


Probabilities that GCOS criteria is met:

Weighted least square:

None %

Ordinary least square:

None %


Temporal anomaly analyis

The variance of the temporal anomalies provides an additional measure about the stability of the signal AFTER removal of the mean seasonal cylce.

+000 deg


+057/+063 deg