TUKURUI


Location

lon / lat [deg]: -49.6833 / -3.7167

Source network: AERONET


Geostationary surface albedo (GSA) data


“+000”


“+057/+063”


Landcover information (based on ESA CCI landcover data)


Landcover fractions @ 2km distance


Landcover fractions @ 20 km distance


Legend


Distance to open water bodies [km]:

1.71

Distance to urban areas [km]:

2.33


Radius: 1 km

Number of landcover classes:

4

Dominant landcover type:

10: cropland, rainfed

Fraction of dominant landcover type [%]:

66.0


Radius: 2 km

Number of landcover classes:

6

Dominant landcover type:

50: Tree cover, broadleaved, evergreen, closed to open (>15%)

Fraction of dominant landcover type [%]:

41.0


Radius: 5 km

Number of landcover classes:

6

Dominant landcover type:

50: Tree cover, broadleaved, evergreen, closed to open (>15%)

Fraction of dominant landcover type [%]:

45.0


Radius: 10 km

Number of landcover classes:

7

Dominant landcover type:

50: Tree cover, broadleaved, evergreen, closed to open (>15%)

Fraction of dominant landcover type [%]:

51.0


Radius: 20 km

Number of landcover classes:

9

Dominant landcover type:

50: Tree cover, broadleaved, evergreen, closed to open (>15%)

Fraction of dominant landcover type [%]:

51.0


Disturbances


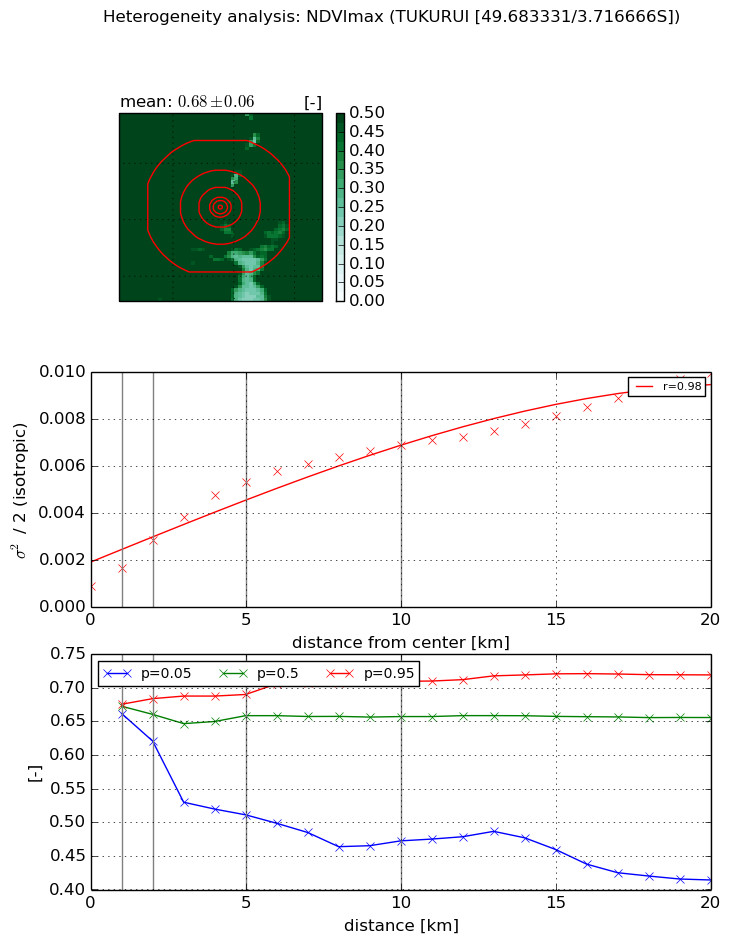
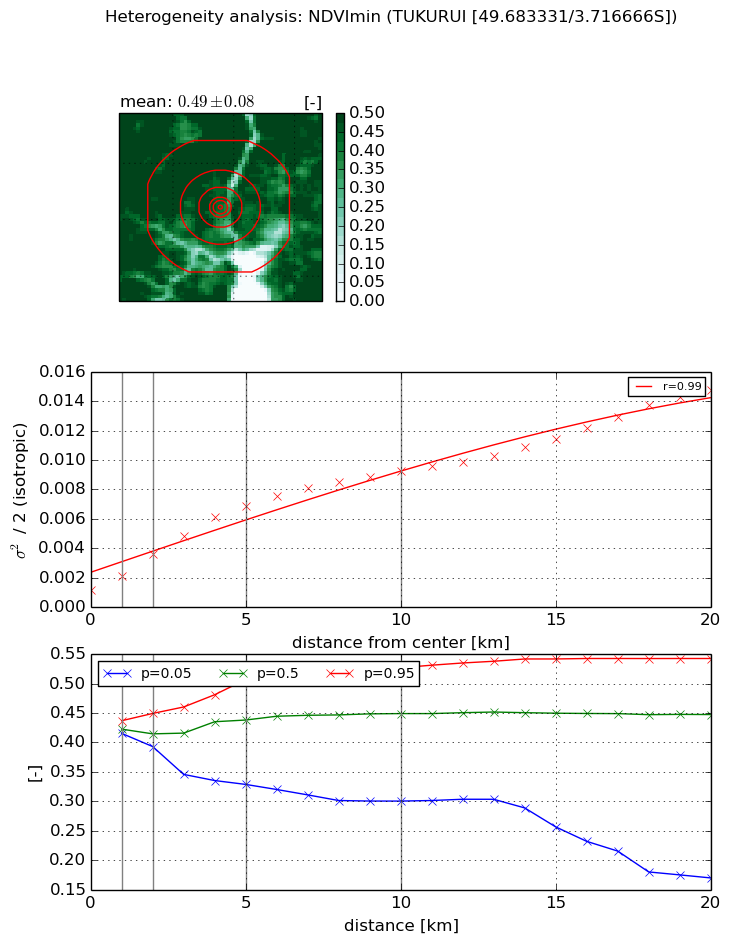
Heterogeneity analysis

The heterogeneity analysis provides information about the spatial and temporal heterogeneity of the site.

Topography


Roman et al. (2009) index


St

2.95355507408

Rcv

0.218294443446

Rse

0.0

Rst

-7.93426200165e-06

Rsv

-0.797422714515


Height range @ 1km [m]

16

Height range @ 2km [m]

31

Height range @ 5km [m]

53

Height range @ 10km [m]

-999

Height range @ 20km [m]

-999


Variance slope @ 1 km

13

Variance slope @ 2 km

27

Variance slope @ 5 km

63

Variance slope @ 10 km

-999

Variance slope @ 20 km

-999


NDVI (max. NDVI composite)


Roman et al. (2009) index


St

4.59070928244e-07

Rcv

0.0994875507294

Rse

0.0

Rst

0.0815790284797

Rsv

6534937.702


NDVI range @ 1km [-]

0.01

NDVI range @ 2km [-]

0.06

NDVI range @ 5km [-]

0.18

NDVI range @ 10km [-]

0.24

NDVI range @ 20km [-]

0.31


Variance slope @ 1 km

0.000751769482633

Variance slope @ 2 km

0.000972419710482

Variance slope @ 5 km

0.000924636270574

Variance slope @ 10 km

0.000598647997974

Variance slope @ 20 km

0.000390698281398


NDVI (min. NDVI composite)I


Roman et al. (2009) index


St

1.21191132628e-06

Rcv

0.38023070577

Rse

0.0

Rst

0.12259980431

Rsv

2475428.13204


NDVI range @ 1km [-]

0.02

NDVI range @ 2km [-]

0.06

NDVI range @ 5km [-]

0.18

NDVI range @ 10km [-]

0.23

NDVI range @ 20km [-]

0.37


NDVI slope @ 1 km

0.00094572980582

NDVI slope @ 2 km

0.00122444153478

NDVI slope @ 5 km

0.00119218549234

NDVI slope @ 10 km

0.000816901658687

NDVI slope @ 20 km

0.000604564201794


Temporal stability analysis

+000 deg (BHR)


BHR statistics

Temporal stability [1/decade]:


abs

rel


Weighted least square:

-99999.0


Ordinary least square:

-99999.0


Probabilities that GCOS criteria is met:

Weighted least square:

-99999.0 %

Ordinary least square:

-99999.0 %


DHR statistics

Temporal stability [1/decade]:


abs

rel


Weighted least square:

-99999.0


Ordinary least square:

-99999.0


Probabilities that GCOS criteria is met:

Weighted least square:

-99999.0 %

Ordinary least square:

-99999.0 %


+057/+063 deg (BHR)


BHR statistics

Temporal stability [1/decade]:


abs

rel


Weighted least square:

None


Ordinary least square:

None


Probabilities that GCOS criteria is met:

Weighted least square:

None %

Ordinary least square:

None %


DHR statistics

Temporal stability [1/decade]:


abs

rel


Weighted least square:

None


Ordinary least square:

None


Probabilities that GCOS criteria is met:

Weighted least square:

None %

Ordinary least square:

None %


Temporal anomaly analyis

The variance of the temporal anomalies provides an additional measure about the stability of the signal AFTER removal of the mean seasonal cylce.

+000 deg


+057/+063 deg