TUZ_GOLU_00002


Location

lon / lat [deg]: 33.449 / 38.837

Source network: AERONET


Geostationary surface albedo (GSA) data


“+000”


“+057/+063”


Landcover information (based on ESA CCI landcover data)


Landcover fractions @ 2km distance


Landcover fractions @ 20 km distance


Legend


Distance to open water bodies [km]:

0.37

Distance to urban areas [km]:

0.07


Radius: 1 km

Number of landcover classes:

3

Dominant landcover type:

130: grassland

Fraction of dominant landcover type [%]:

49.0


Radius: 2 km

Number of landcover classes:

5

Dominant landcover type:

130: grassland

Fraction of dominant landcover type [%]:

49.0


Radius: 5 km

Number of landcover classes:

7

Dominant landcover type:

210: water bodies

Fraction of dominant landcover type [%]:

46.0


Radius: 10 km

Number of landcover classes:

6

Dominant landcover type:

210: water bodies

Fraction of dominant landcover type [%]:

56.0


Radius: 20 km

Number of landcover classes:

6

Dominant landcover type:

210: water bodies

Fraction of dominant landcover type [%]:

63.0


Disturbances


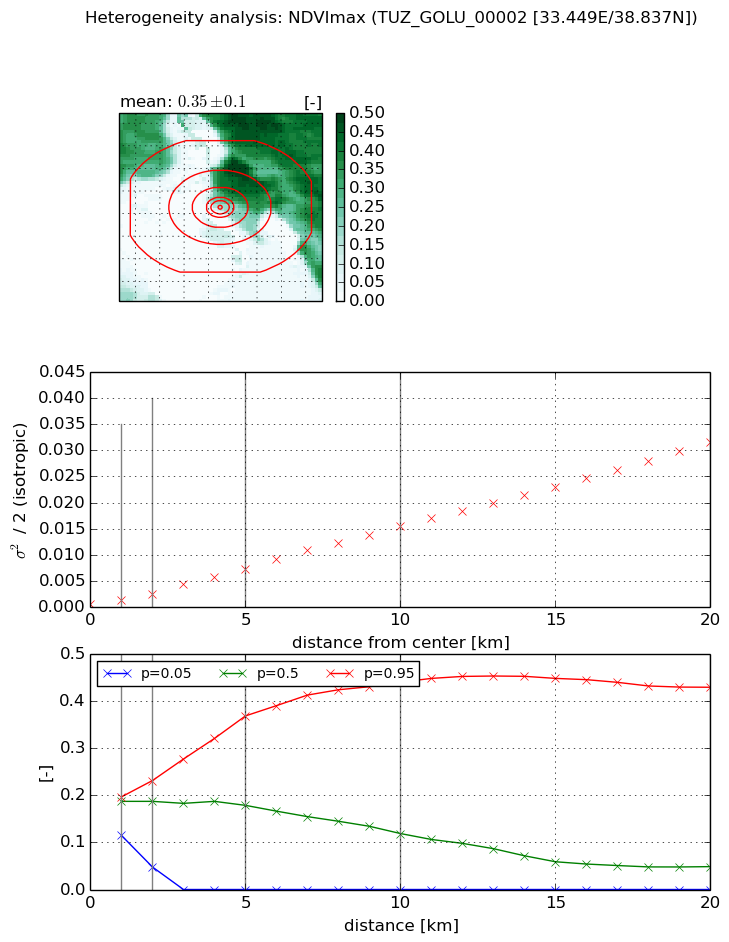
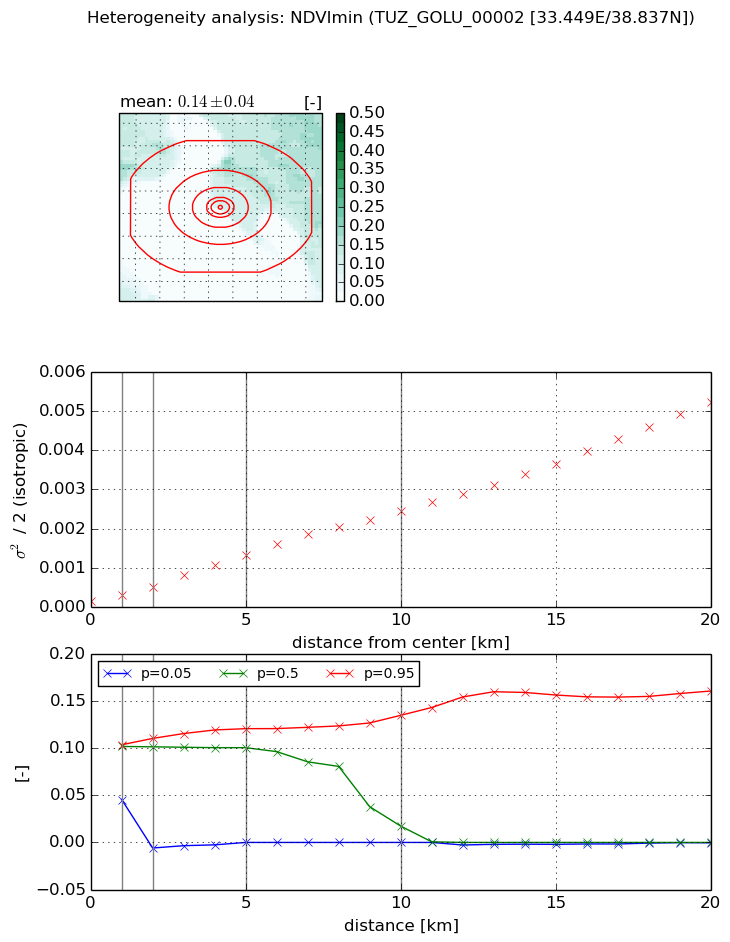
Heterogeneity analysis

The heterogeneity analysis provides information about the spatial and temporal heterogeneity of the site.

Topography


Roman et al. (2009) index


St

5.32020706512e-05

Rcv

0.30954859074

Rse

0.0

Rst

0.0534823299968

Rsv

56388.4196476


Height range @ 1km [m]

37

Height range @ 2km [m]

81

Height range @ 5km [m]

137

Height range @ 10km [m]

-999

Height range @ 20km [m]

-999


Variance slope @ 1 km

350

Variance slope @ 2 km

480

Variance slope @ 5 km

557

Variance slope @ 10 km

-999

Variance slope @ 20 km

-999


NDVI (max. NDVI composite)


Roman et al. (2009) index


St

1.95802497864

Rcv

0.349019100225

Rse

0.0

Rst

-0.183137198075

Rsv

-0.999999845122


NDVI range @ 1km [-]

0.08

NDVI range @ 2km [-]

0.18

NDVI range @ 5km [-]

0.37

NDVI range @ 10km [-]

0.44

NDVI range @ 20km [-]

0.43


Variance slope @ 1 km

0.000786618247508

Variance slope @ 2 km

0.000893404552455

Variance slope @ 5 km

0.00138160791686

Variance slope @ 10 km

0.00154119127773

Variance slope @ 20 km

0.00156450657264


NDVI (min. NDVI composite)I


Roman et al. (2009) index


St

2.78483897985

Rcv

0.218635574198

Rse

0.0

Rst

-0.148274605692

Rsv

0.710351385934


NDVI range @ 1km [-]

0.06

NDVI range @ 2km [-]

0.12

NDVI range @ 5km [-]

0.12

NDVI range @ 10km [-]

0.14

NDVI range @ 20km [-]

0.16


NDVI slope @ 1 km

0.000159130544862

NDVI slope @ 2 km

0.000171669019221

NDVI slope @ 5 km

0.000239668061889

NDVI slope @ 10 km

0.000238123718069

NDVI slope @ 20 km

0.00024839793533


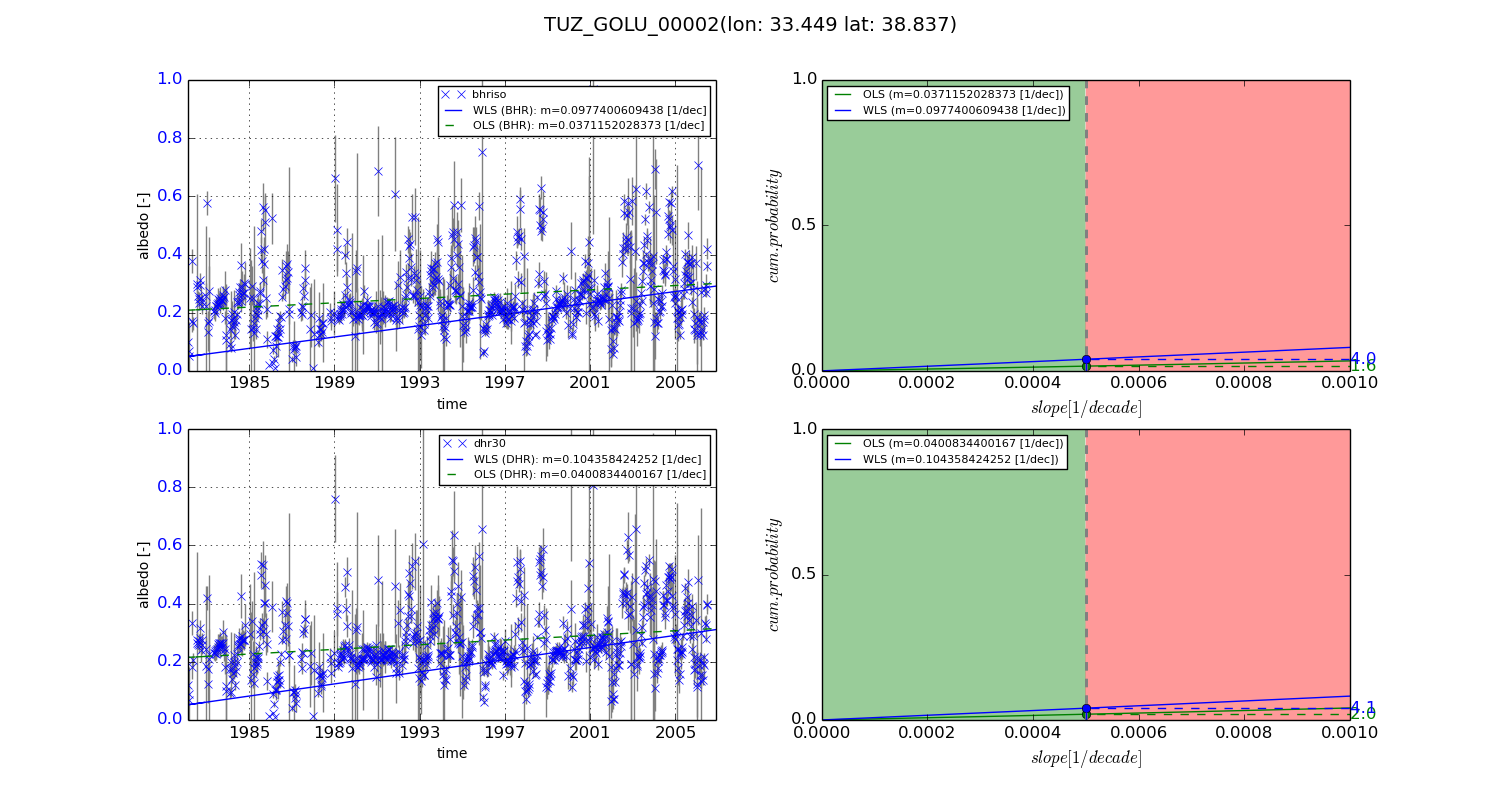
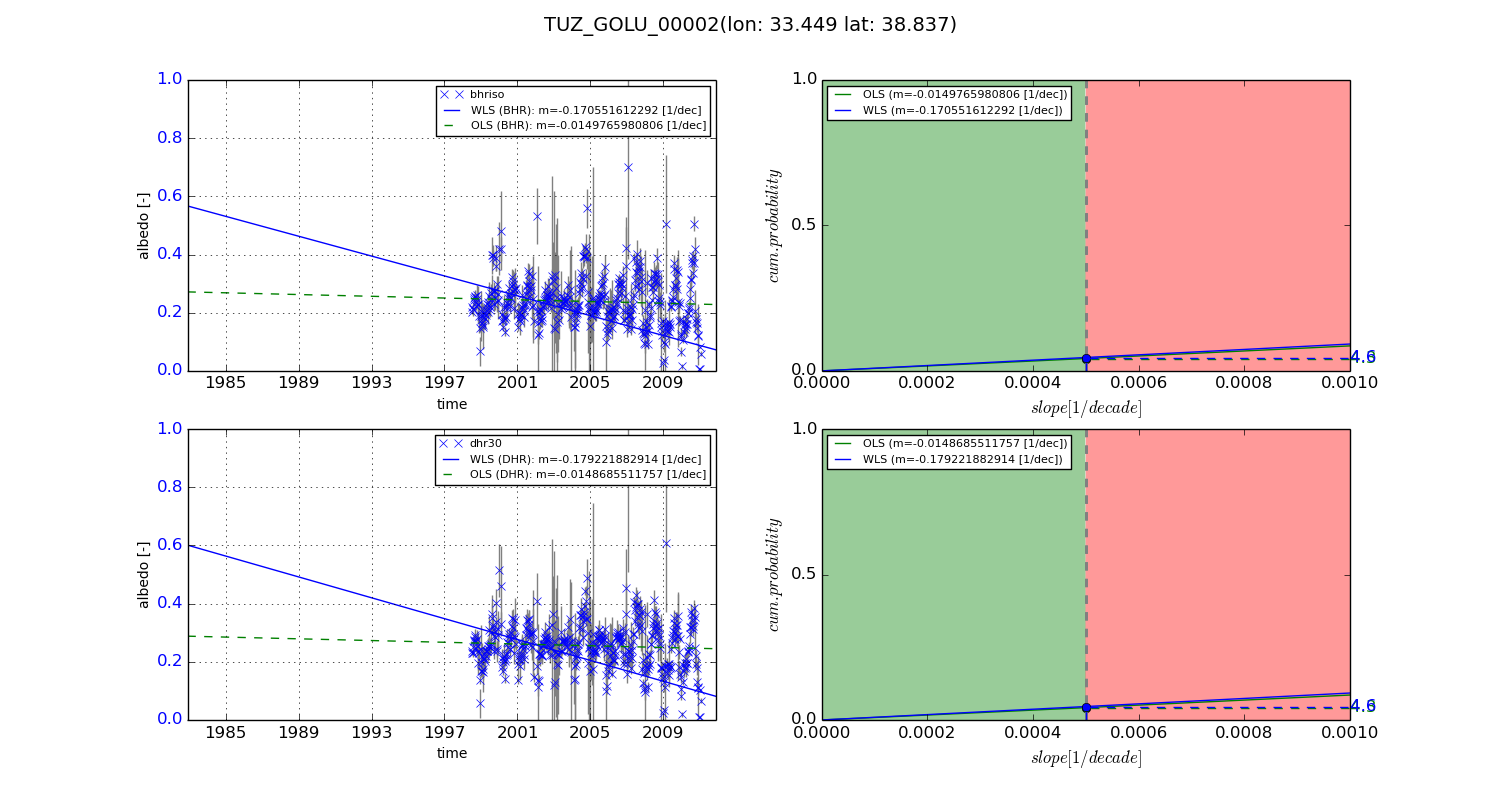
Temporal stability analysis

+000 deg (BHR)


BHR statistics

Temporal stability [1/decade]:


abs

rel


Weighted least square:

0.0977400609438


Ordinary least square:

0.0371152028373


Probabilities that GCOS criteria is met:

Weighted least square:

4.0 %

Ordinary least square:

1.6 %


DHR statistics

Temporal stability [1/decade]:


abs

rel


Weighted least square:

0.104358424252


Ordinary least square:

0.0400834400167


Probabilities that GCOS criteria is met:

Weighted least square:

4.1 %

Ordinary least square:

2.0 %


+057/+063 deg (BHR)


BHR statistics

Temporal stability [1/decade]:


abs

rel


Weighted least square:

-0.170551612292


Ordinary least square:

-0.0149765980806


Probabilities that GCOS criteria is met:

Weighted least square:

4.6 %

Ordinary least square:

4.3 %


DHR statistics

Temporal stability [1/decade]:


abs

rel


Weighted least square:

-0.179221882914


Ordinary least square:

-0.0148685511757


Probabilities that GCOS criteria is met:

Weighted least square:

4.6 %

Ordinary least square:

4.3 %


Temporal anomaly analyis

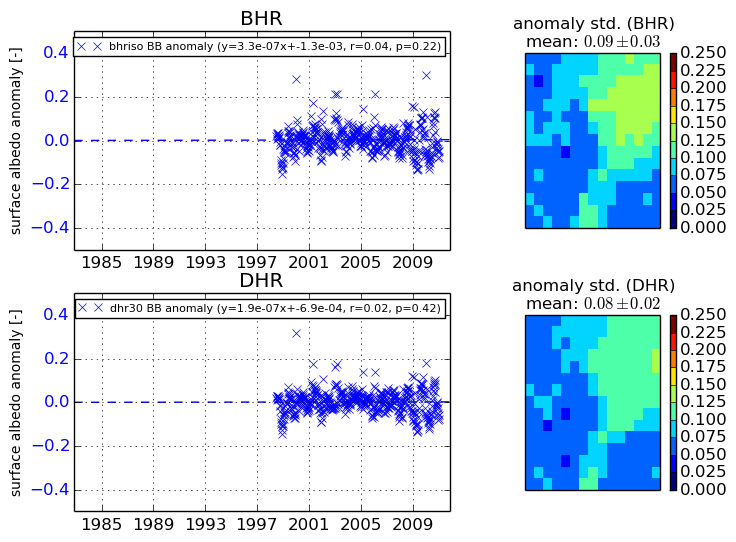
The variance of the temporal anomalies provides an additional measure about the stability of the signal AFTER removal of the mean seasonal cylce.
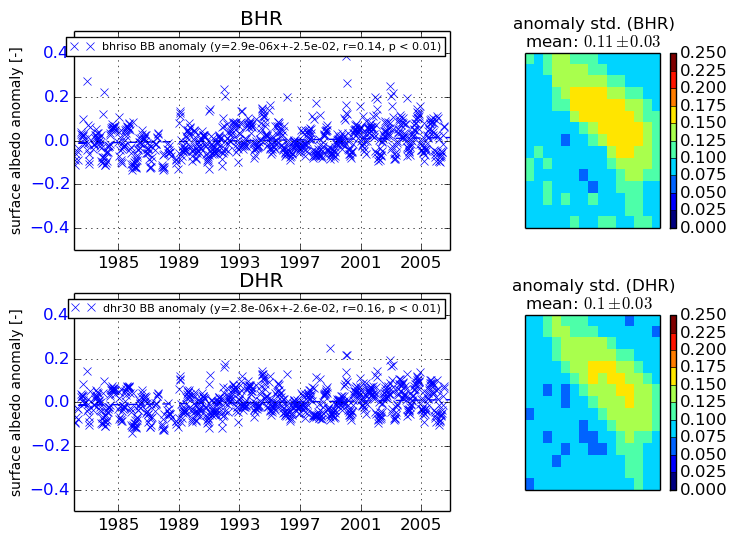
+000 deg


+057/+063 deg