UAHUNTSVILLE


Location

lon / lat [deg]: -86.6447 / 34.7253

Source network: AERONET


Geostationary surface albedo (GSA) data


“+000”


“+057/+063”


Landcover information (based on ESA CCI landcover data)


Landcover fractions @ 2km distance


Landcover fractions @ 20 km distance


Legend


Distance to open water bodies [km]:

2.68

Distance to urban areas [km]:

0.16


Radius: 1 km

Number of landcover classes:

1

Dominant landcover type:

190: urban areas

Fraction of dominant landcover type [%]:

100.0


Radius: 2 km

Number of landcover classes:

1

Dominant landcover type:

190: urban areas

Fraction of dominant landcover type [%]:

100.0


Radius: 5 km

Number of landcover classes:

5

Dominant landcover type:

190: urban areas

Fraction of dominant landcover type [%]:

73.0


Radius: 10 km

Number of landcover classes:

7

Dominant landcover type:

190: urban areas

Fraction of dominant landcover type [%]:

55.0


Radius: 20 km

Number of landcover classes:

8

Dominant landcover type:

130: grassland

Fraction of dominant landcover type [%]:

41.0


Disturbances


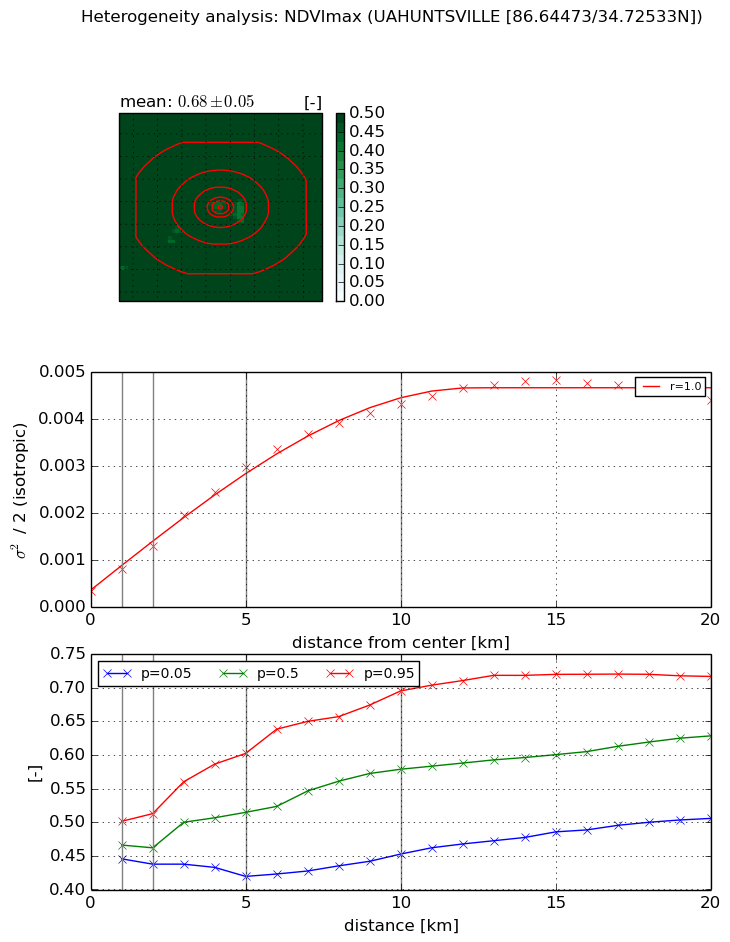
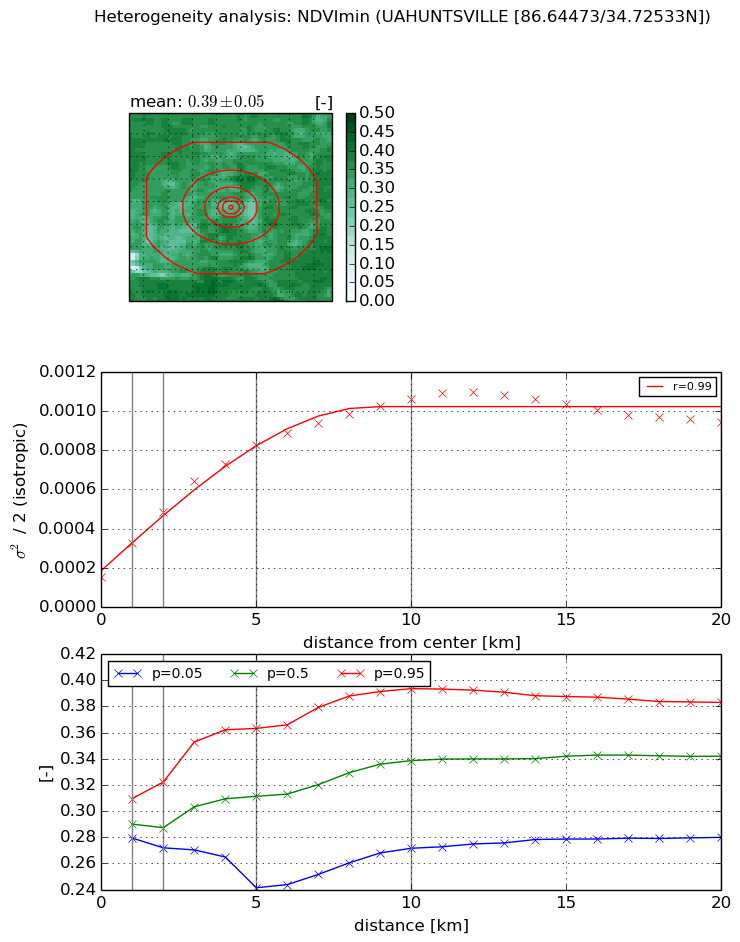
Heterogeneity analysis

The heterogeneity analysis provides information about the spatial and temporal heterogeneity of the site.

Topography


Roman et al. (2009) index


St

2.95743674479

Rcv

0.851765135062

Rse

0.0

Rst

0.0664172927802

Rsv

0.0962095131809


Height range @ 1km [m]

16

Height range @ 2km [m]

23

Height range @ 5km [m]

63

Height range @ 10km [m]

-999

Height range @ 20km [m]

-999


Variance slope @ 1 km

221

Variance slope @ 2 km

183

Variance slope @ 5 km

78

Variance slope @ 10 km

-999

Variance slope @ 20 km

-999


NDVI (max. NDVI composite)


Roman et al. (2009) index


St

2.00141109652

Rcv

0.484294618397

Rse

0.0

Rst

-0.0180510704452

Rsv

0.996596734935


NDVI range @ 1km [-]

0.06

NDVI range @ 2km [-]

0.08

NDVI range @ 5km [-]

0.18

NDVI range @ 10km [-]

0.24

NDVI range @ 20km [-]

0.21


Variance slope @ 1 km

0.000452521938891

Variance slope @ 2 km

0.000478398280454

Variance slope @ 5 km

0.000537182464957

Variance slope @ 10 km

0.000410843289745

Variance slope @ 20 km

0.000200615546306


NDVI (min. NDVI composite)I


Roman et al. (2009) index


St

2.5450524499

Rcv

0.424035433396

Rse

0.0

Rst

0.024418628291

Rsv

0.730303570645


NDVI range @ 1km [-]

0.03

NDVI range @ 2km [-]

0.05

NDVI range @ 5km [-]

0.12

NDVI range @ 10km [-]

0.12

NDVI range @ 20km [-]

0.1


NDVI slope @ 1 km

0.000169342003555

NDVI slope @ 2 km

0.000164301229144

NDVI slope @ 5 km

0.000134851327141

NDVI slope @ 10 km

8.71498996847e-05

NDVI slope @ 20 km

3.11149091892e-05


Temporal stability analysis

+000 deg (BHR)


BHR statistics

Temporal stability [1/decade]:


abs

rel


Weighted least square:

None


Ordinary least square:

None


Probabilities that GCOS criteria is met:

Weighted least square:

None %

Ordinary least square:

None %


DHR statistics

Temporal stability [1/decade]:


abs

rel


Weighted least square:

None


Ordinary least square:

None


Probabilities that GCOS criteria is met:

Weighted least square:

None %

Ordinary least square:

None %


+057/+063 deg (BHR)


BHR statistics

Temporal stability [1/decade]:


abs

rel


Weighted least square:

None


Ordinary least square:

None


Probabilities that GCOS criteria is met:

Weighted least square:

None %

Ordinary least square:

None %


DHR statistics

Temporal stability [1/decade]:


abs

rel


Weighted least square:

None


Ordinary least square:

None


Probabilities that GCOS criteria is met:

Weighted least square:

None %

Ordinary least square:

None %


Temporal anomaly analyis

The variance of the temporal anomalies provides an additional measure about the stability of the signal AFTER removal of the mean seasonal cylce.

+000 deg


+057/+063 deg