UARDRY


Location

lon / lat [deg]: 145.3 / -34.39

Source network: EOS_LAND


Geostationary surface albedo (GSA) data


“+000”


“+057/+063”


Landcover information (based on ESA CCI landcover data)


Landcover fractions @ 2km distance


Landcover fractions @ 20 km distance


Legend


Distance to open water bodies [km]:

17.27

Distance to urban areas [km]:

42.78


Radius: 1 km

Number of landcover classes:

2

Dominant landcover type:

40: mosaic natural vegetation (tree, shrub, herbaceous cover) (>50%) / cropland (<50%)

Fraction of dominant landcover type [%]:

76.0


Radius: 2 km

Number of landcover classes:

3

Dominant landcover type:

40: mosaic natural vegetation (tree, shrub, herbaceous cover) (>50%) / cropland (<50%)

Fraction of dominant landcover type [%]:

54.0


Radius: 5 km

Number of landcover classes:

5

Dominant landcover type:

40: mosaic natural vegetation (tree, shrub, herbaceous cover) (>50%) / cropland (<50%)

Fraction of dominant landcover type [%]:

57.0


Radius: 10 km

Number of landcover classes:

5

Dominant landcover type:

40: mosaic natural vegetation (tree, shrub, herbaceous cover) (>50%) / cropland (<50%)

Fraction of dominant landcover type [%]:

51.0


Radius: 20 km

Number of landcover classes:

5

Dominant landcover type:

40: mosaic natural vegetation (tree, shrub, herbaceous cover) (>50%) / cropland (<50%)

Fraction of dominant landcover type [%]:

38.0


Disturbances


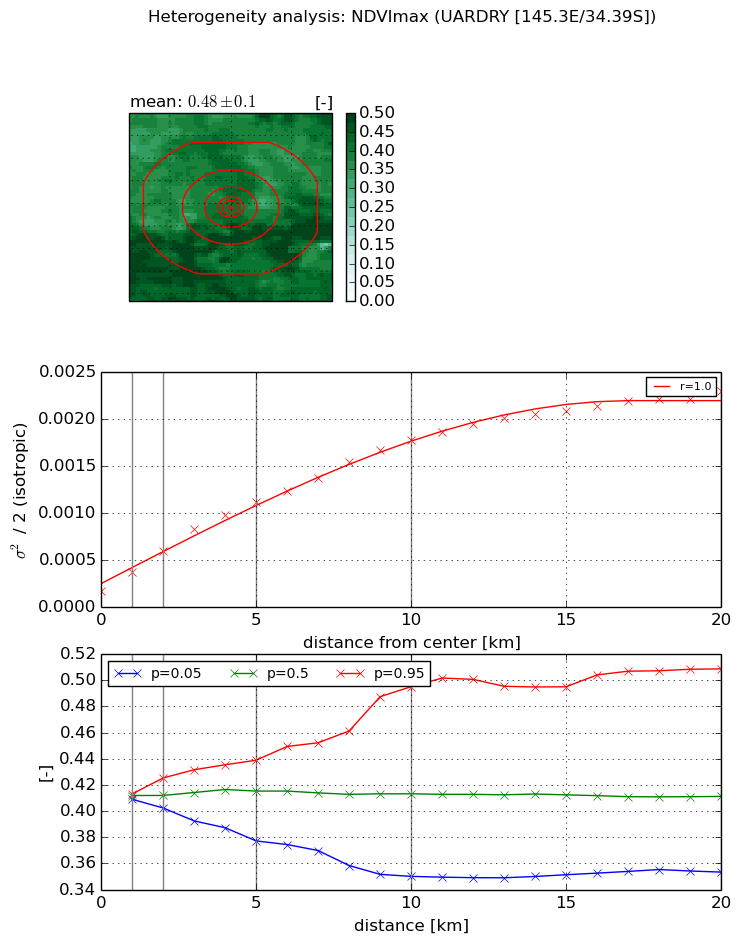
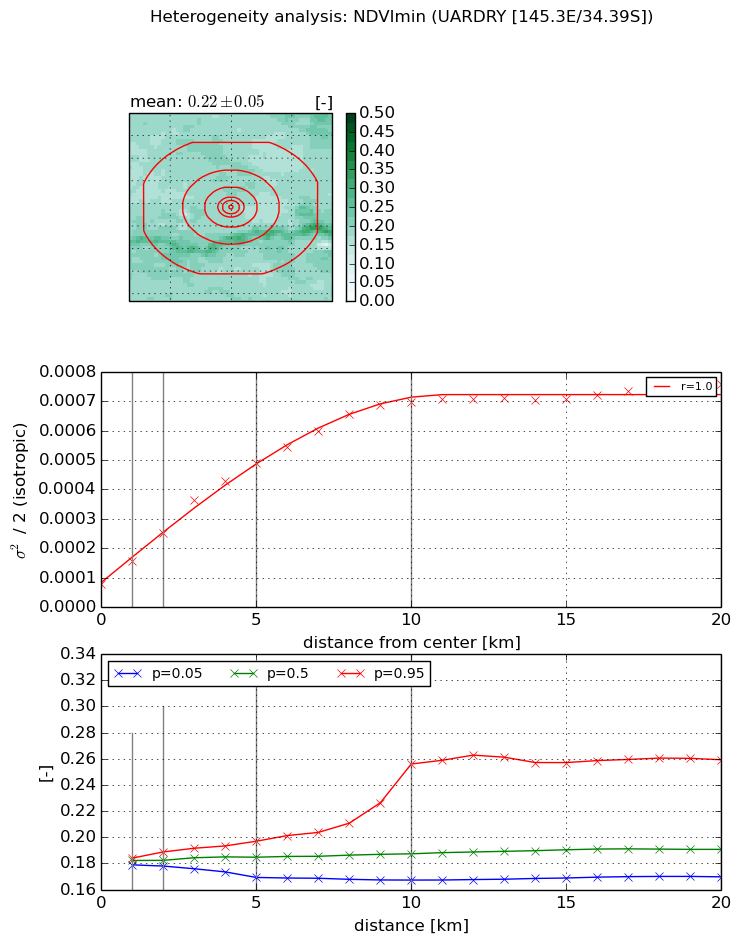
Heterogeneity analysis

The heterogeneity analysis provides information about the spatial and temporal heterogeneity of the site.

Topography


Roman et al. (2009) index


St

3.9520723348

Rcv

0.160305409125

Rse

0.0

Rst

-0.0665308379911

Rsv

0.532259170643


Height range @ 1km [m]

3

Height range @ 2km [m]

3

Height range @ 5km [m]

4

Height range @ 10km [m]

-999

Height range @ 20km [m]

-999


Variance slope @ 1 km

0

Variance slope @ 2 km

0

Variance slope @ 5 km

0

Variance slope @ 10 km

-999

Variance slope @ 20 km

-999


NDVI (max. NDVI composite)


Roman et al. (2009) index


St

7.53586741581e-06

Rcv

1.03768515159

Rse

0.0

Rst

0.385667450013

Rsv

398094.752505


NDVI range @ 1km [-]

0.0

NDVI range @ 2km [-]

0.02

NDVI range @ 5km [-]

0.06

NDVI range @ 10km [-]

0.15

NDVI range @ 20km [-]

0.16


Variance slope @ 1 km

0.000196387919006

Variance slope @ 2 km

0.00020945647209

Variance slope @ 5 km

0.00019337923122

Variance slope @ 10 km

0.000158117501292

Variance slope @ 20 km

0.000101521866526


NDVI (min. NDVI composite)I


Roman et al. (2009) index


St

1.91391106476

Rcv

0.502210686592

Rse

0.0

Rst

-0.130765748804

Rsv

0.934494517274


NDVI range @ 1km [-]

0.01

NDVI range @ 2km [-]

0.01

NDVI range @ 5km [-]

0.03

NDVI range @ 10km [-]

0.09

NDVI range @ 20km [-]

0.09


NDVI slope @ 1 km

7.87799059e-05

NDVI slope @ 2 km

8.78346341237e-05

NDVI slope @ 5 km

8.54947484877e-05

NDVI slope @ 10 km

6.37927179743e-05

NDVI slope @ 20 km

2.93220848515e-05


Temporal stability analysis

+000 deg (BHR)


BHR statistics

Temporal stability [1/decade]:


abs

rel


Weighted least square:

None


Ordinary least square:

None


Probabilities that GCOS criteria is met:

Weighted least square:

None %

Ordinary least square:

None %


DHR statistics

Temporal stability [1/decade]:


abs

rel


Weighted least square:

None


Ordinary least square:

None


Probabilities that GCOS criteria is met:

Weighted least square:

None %

Ordinary least square:

None %


+057/+063 deg (BHR)


BHR statistics

Temporal stability [1/decade]:


abs

rel


Weighted least square:

None


Ordinary least square:

None


Probabilities that GCOS criteria is met:

Weighted least square:

None %

Ordinary least square:

None %


DHR statistics

Temporal stability [1/decade]:


abs

rel


Weighted least square:

None


Ordinary least square:

None


Probabilities that GCOS criteria is met:

Weighted least square:

None %

Ordinary least square:

None %


Temporal anomaly analyis

The variance of the temporal anomalies provides an additional measure about the stability of the signal AFTER removal of the mean seasonal cylce.

+000 deg


+057/+063 deg