UBERLANDIA


Location

lon / lat [deg]: -48.2833 / -18.9

Source network: AERONET


Geostationary surface albedo (GSA) data


“+000”


“+057/+063”


Landcover information (based on ESA CCI landcover data)


Landcover fractions @ 2km distance


Landcover fractions @ 20 km distance


Legend


Distance to open water bodies [km]:

4.67

Distance to urban areas [km]:

0.21


Radius: 1 km

Number of landcover classes:

1

Dominant landcover type:

190: urban areas

Fraction of dominant landcover type [%]:

100.0


Radius: 2 km

Number of landcover classes:

1

Dominant landcover type:

190: urban areas

Fraction of dominant landcover type [%]:

100.0


Radius: 5 km

Number of landcover classes:

2

Dominant landcover type:

190: urban areas

Fraction of dominant landcover type [%]:

93.0


Radius: 10 km

Number of landcover classes:

3

Dominant landcover type:

10: cropland, rainfed

Fraction of dominant landcover type [%]:

50.0


Radius: 20 km

Number of landcover classes:

3

Dominant landcover type:

10: cropland, rainfed

Fraction of dominant landcover type [%]:

81.0


Disturbances


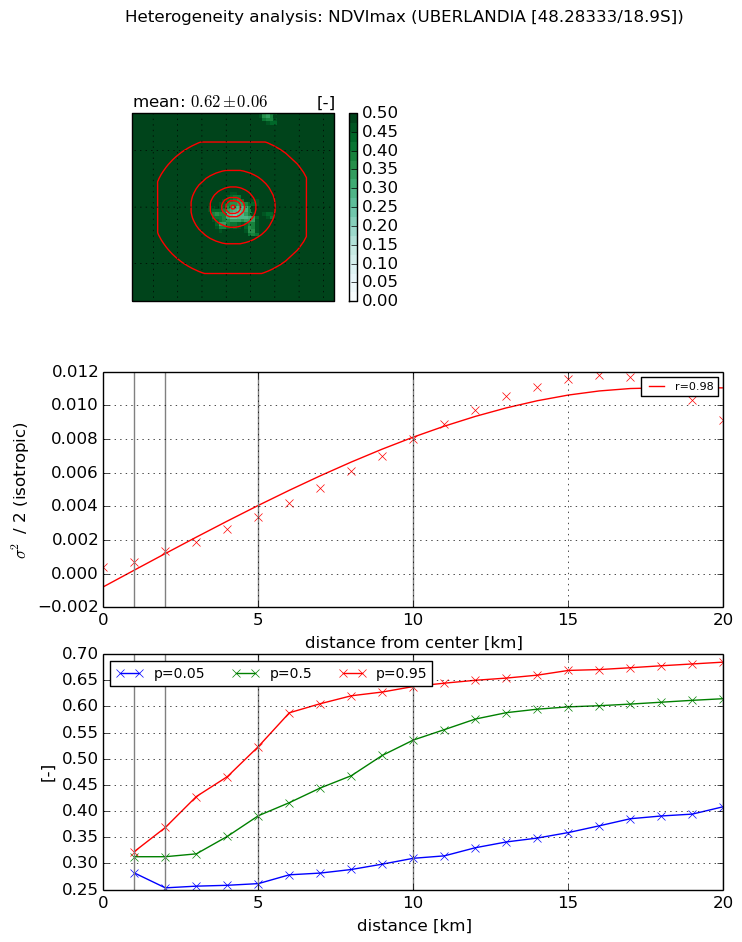
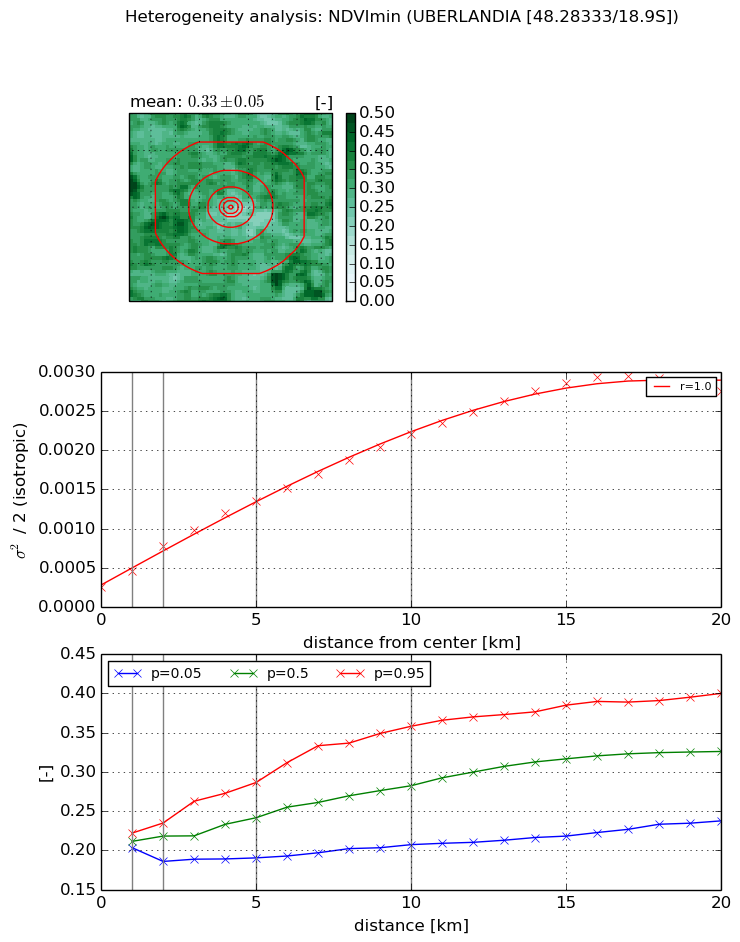
Heterogeneity analysis

The heterogeneity analysis provides information about the spatial and temporal heterogeneity of the site.

Topography


Roman et al. (2009) index


St

2.43360172734

Rcv

0.273694585535

Rse

0.0

Rst

-8.58918109621e-05

Rsv

-0.958960265024


Height range @ 1km [m]

51

Height range @ 2km [m]

69

Height range @ 5km [m]

142

Height range @ 10km [m]

-999

Height range @ 20km [m]

-999


Variance slope @ 1 km

371

Variance slope @ 2 km

359

Variance slope @ 5 km

297

Variance slope @ 10 km

-999

Variance slope @ 20 km

-999


NDVI (max. NDVI composite)


Roman et al. (2009) index


St

7.02906705685e-08

Rcv

0.186116418243

Rse

0.0

Rst

0.30361252544

Rsv

42679916.7132


NDVI range @ 1km [-]

0.04

NDVI range @ 2km [-]

0.12

NDVI range @ 5km [-]

0.26

NDVI range @ 10km [-]

0.33

NDVI range @ 20km [-]

0.28


Variance slope @ 1 km

0.000329934151393

Variance slope @ 2 km

0.000492239682463

Variance slope @ 5 km

0.000608267061208

Variance slope @ 10 km

0.000777089995477

Variance slope @ 20 km

0.000612020550075


NDVI (min. NDVI composite)I


Roman et al. (2009) index


St

2.14796203654e-07

Rcv

0.133453521958

Rse

0.0

Rst

0.379019407848

Rsv

13966726.7805


NDVI range @ 1km [-]

0.02

NDVI range @ 2km [-]

0.05

NDVI range @ 5km [-]

0.1

NDVI range @ 10km [-]

0.15

NDVI range @ 20km [-]

0.16


NDVI slope @ 1 km

0.000201019300854

NDVI slope @ 2 km

0.000262056359148

NDVI slope @ 5 km

0.000225780664757

NDVI slope @ 10 km

0.000192081634565

NDVI slope @ 20 km

0.000136111940053


Temporal stability analysis

+000 deg (BHR)


BHR statistics

Temporal stability [1/decade]:


abs

rel


Weighted least square:

-99999.0


Ordinary least square:

-99999.0


Probabilities that GCOS criteria is met:

Weighted least square:

-99999.0 %

Ordinary least square:

-99999.0 %


DHR statistics

Temporal stability [1/decade]:


abs

rel


Weighted least square:

-99999.0


Ordinary least square:

-99999.0


Probabilities that GCOS criteria is met:

Weighted least square:

-99999.0 %

Ordinary least square:

-99999.0 %


+057/+063 deg (BHR)


BHR statistics

Temporal stability [1/decade]:


abs

rel


Weighted least square:

None


Ordinary least square:

None


Probabilities that GCOS criteria is met:

Weighted least square:

None %

Ordinary least square:

None %


DHR statistics

Temporal stability [1/decade]:


abs

rel


Weighted least square:

None


Ordinary least square:

None


Probabilities that GCOS criteria is met:

Weighted least square:

None %

Ordinary least square:

None %


Temporal anomaly analyis

The variance of the temporal anomalies provides an additional measure about the stability of the signal AFTER removal of the mean seasonal cylce.

+000 deg


+057/+063 deg