UK-GRI


Location

lon / lat [deg]: -3.7981 / 56.6072

Source network: FLUXNET


Geostationary surface albedo (GSA) data


“+000”


“+057/+063”


Landcover information (based on ESA CCI landcover data)


Landcover fractions @ 2km distance


Landcover fractions @ 20 km distance


Legend


Distance to open water bodies [km]:

1.43

Distance to urban areas [km]:

3.97


Radius: 1 km

Number of landcover classes:

1

Dominant landcover type:

70: Tree cover, needleleaved, evergreen, closed to open (>15%)

Fraction of dominant landcover type [%]:

100.0


Radius: 2 km

Number of landcover classes:

3

Dominant landcover type:

70: Tree cover, needleleaved, evergreen, closed to open (>15%)

Fraction of dominant landcover type [%]:

95.0


Radius: 5 km

Number of landcover classes:

5

Dominant landcover type:

70: Tree cover, needleleaved, evergreen, closed to open (>15%)

Fraction of dominant landcover type [%]:

69.0


Radius: 10 km

Number of landcover classes:

5

Dominant landcover type:

70: Tree cover, needleleaved, evergreen, closed to open (>15%)

Fraction of dominant landcover type [%]:

41.0


Radius: 20 km

Number of landcover classes:

7

Dominant landcover type:

130: grassland

Fraction of dominant landcover type [%]:

32.0


Disturbances


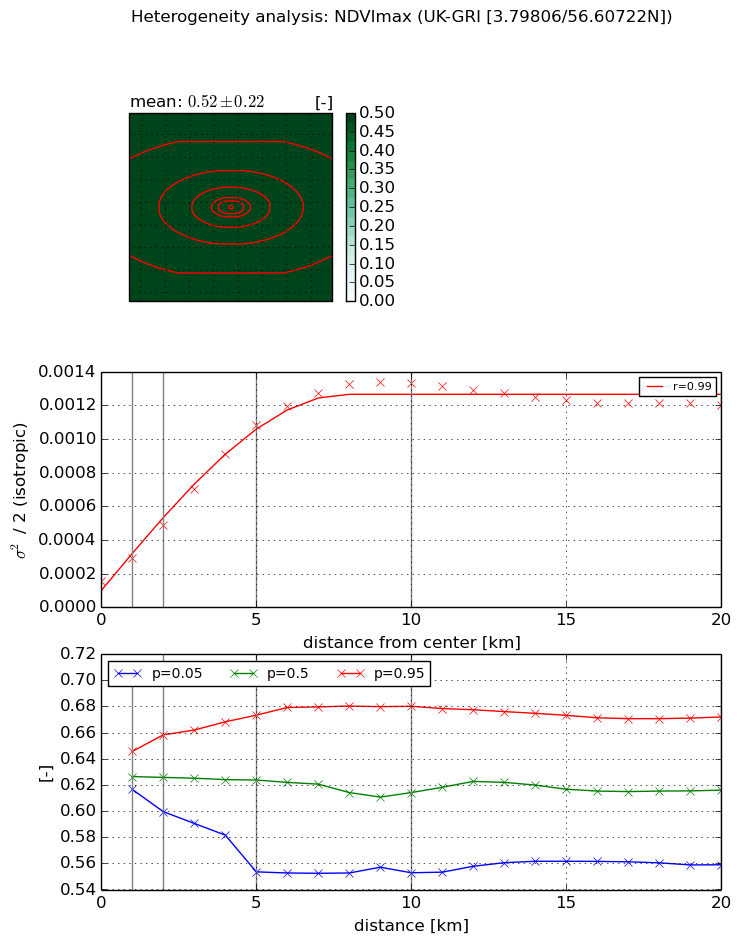
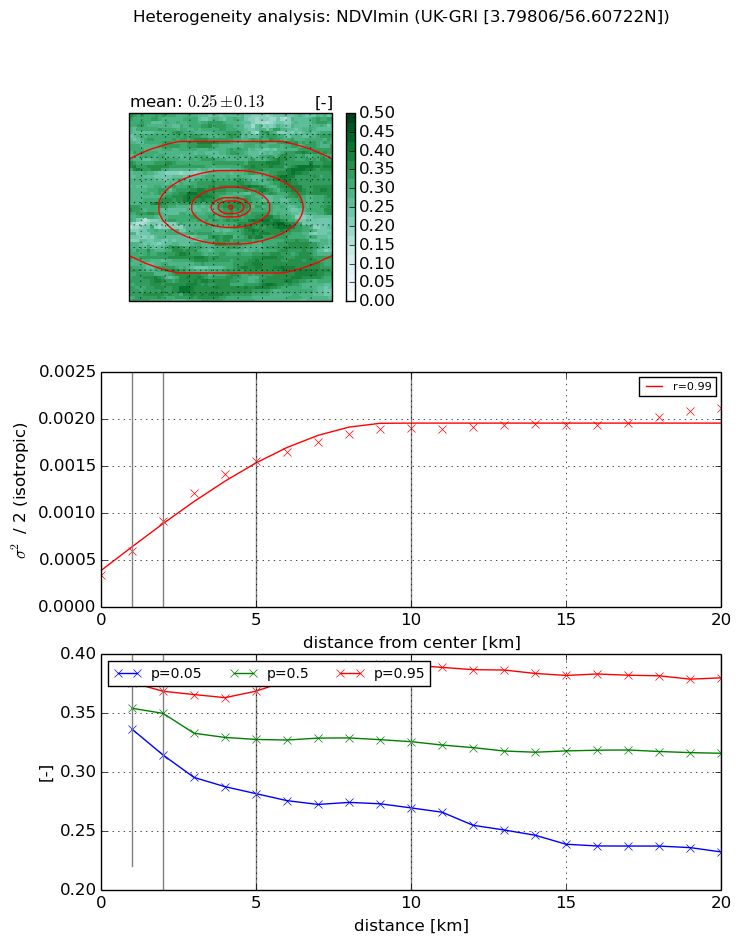
Heterogeneity analysis

The heterogeneity analysis provides information about the spatial and temporal heterogeneity of the site.

Topography


Roman et al. (2009) index


St

2.31523578799

Rcv

0.567085585942

Rse

0.0

Rst

-2.71029619082e-07

Rsv

-0.728678494787


Height range @ 1km [m]

140

Height range @ 2km [m]

215

Height range @ 5km [m]

382

Height range @ 10km [m]

-999

Height range @ 20km [m]

-999


Variance slope @ 1 km

2503

Variance slope @ 2 km

2938

Variance slope @ 5 km

2929

Variance slope @ 10 km

-999

Variance slope @ 20 km

-999


NDVI (max. NDVI composite)


Roman et al. (2009) index


St

1.63709189261

Rcv

0.547385696848

Rse

0.0

Rst

-0.285132111556

Rsv

-0.999999971165


NDVI range @ 1km [-]

0.03

NDVI range @ 2km [-]

0.06

NDVI range @ 5km [-]

0.12

NDVI range @ 10km [-]

0.13

NDVI range @ 20km [-]

0.11


Variance slope @ 1 km

0.000141745050234

Variance slope @ 2 km

0.000167599597355

Variance slope @ 5 km

0.00019205132071

Variance slope @ 10 km

0.000127584866256

Variance slope @ 20 km

4.00564187278e-05


NDVI (min. NDVI composite)I


Roman et al. (2009) index


St

6.33335504731

Rcv

0.201769217083

Rse

0.0

Rst

-0.0405692744842

Rsv

0.231344094928


NDVI range @ 1km [-]

0.04

NDVI range @ 2km [-]

0.05

NDVI range @ 5km [-]

0.09

NDVI range @ 10km [-]

0.12

NDVI range @ 20km [-]

0.15


NDVI slope @ 1 km

0.000255445473021

NDVI slope @ 2 km

0.000285523422367

NDVI slope @ 5 km

0.000251875775464

NDVI slope @ 10 km

0.000155158373899

NDVI slope @ 20 km

6.77531702807e-05


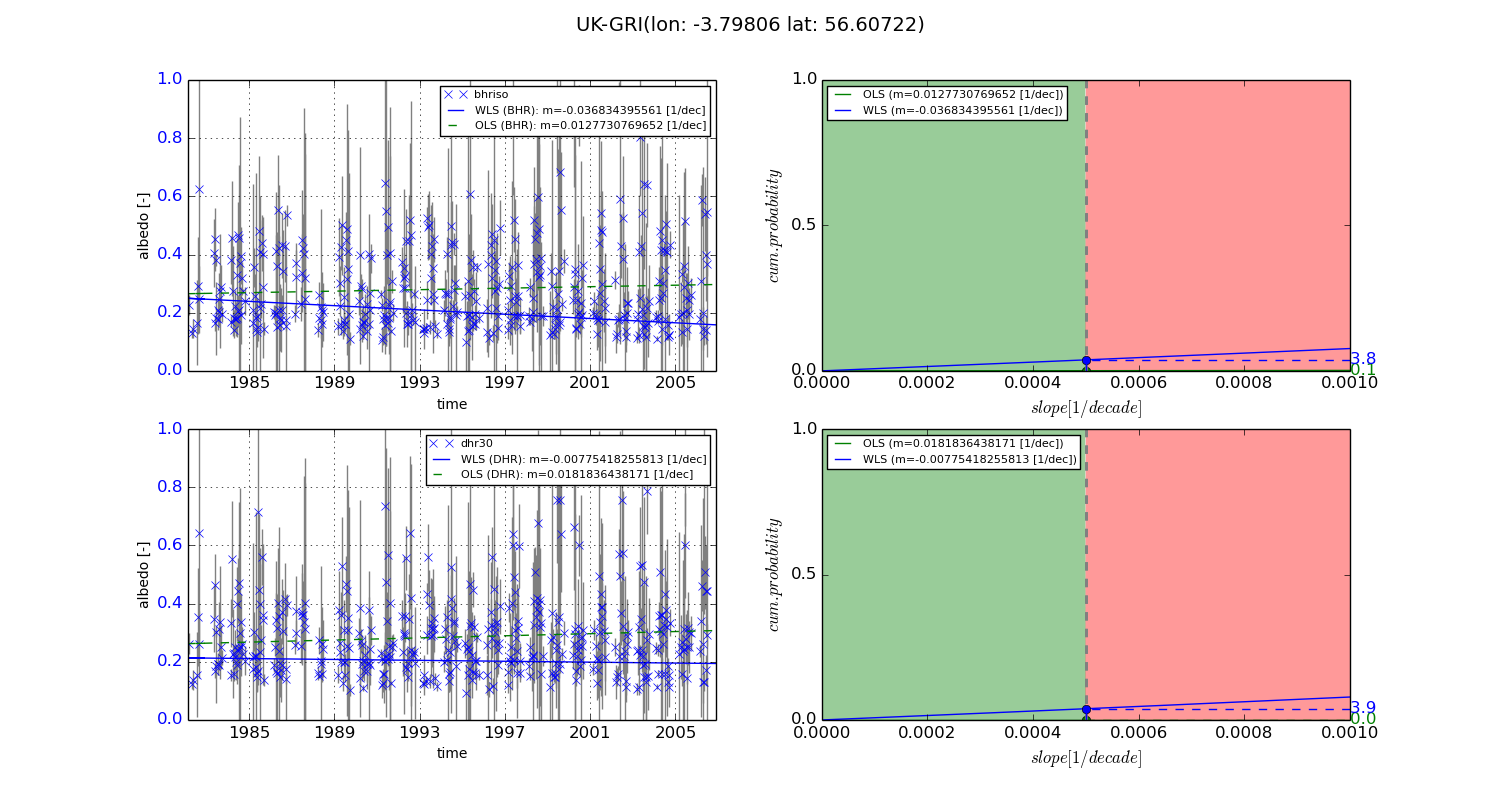
Temporal stability analysis

+000 deg (BHR)


BHR statistics

Temporal stability [1/decade]:


abs

rel


Weighted least square:

-0.036834395561


Ordinary least square:

0.0127730769652


Probabilities that GCOS criteria is met:

Weighted least square:

3.8 %

Ordinary least square:

0.1 %


DHR statistics

Temporal stability [1/decade]:


abs

rel


Weighted least square:

-0.00775418255813


Ordinary least square:

0.0181836438171


Probabilities that GCOS criteria is met:

Weighted least square:

3.9 %

Ordinary least square:

0.0 %


+057/+063 deg (BHR)


BHR statistics

Temporal stability [1/decade]:


abs

rel


Weighted least square:

-99999.0


Ordinary least square:

-99999.0


Probabilities that GCOS criteria is met:

Weighted least square:

-99999.0 %

Ordinary least square:

-99999.0 %


DHR statistics

Temporal stability [1/decade]:


abs

rel


Weighted least square:

-99999.0


Ordinary least square:

-99999.0


Probabilities that GCOS criteria is met:

Weighted least square:

-99999.0 %

Ordinary least square:

-99999.0 %


Temporal anomaly analyis

The variance of the temporal anomalies provides an additional measure about the stability of the signal AFTER removal of the mean seasonal cylce.
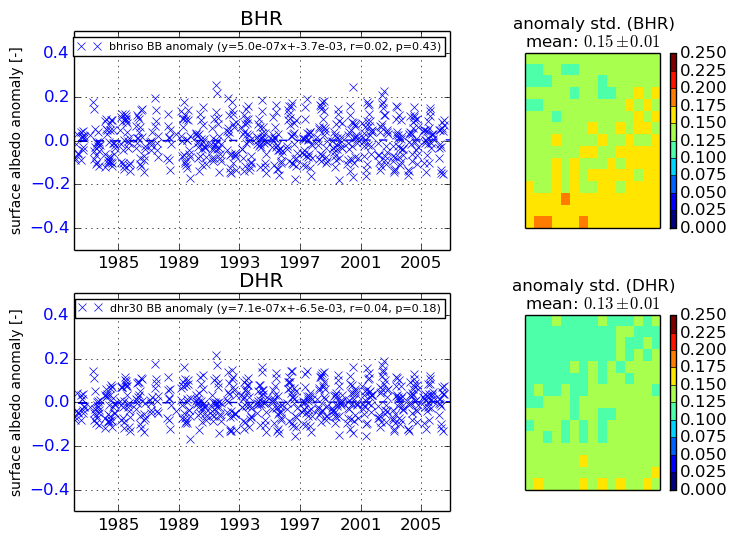
+000 deg


+057/+063 deg