UK-HAM


Location

lon / lat [deg]: -0.8583 / 51.1535

Source network: FLUXNET


Geostationary surface albedo (GSA) data


“+000”


“+057/+063”


Landcover information (based on ESA CCI landcover data)


Landcover fractions @ 2km distance


Landcover fractions @ 20 km distance


Legend


Distance to open water bodies [km]:

4.18

Distance to urban areas [km]:

0.75


Radius: 1 km

Number of landcover classes:

6

Dominant landcover type:

130: grassland

Fraction of dominant landcover type [%]:

31.0


Radius: 2 km

Number of landcover classes:

5

Dominant landcover type:

130: grassland

Fraction of dominant landcover type [%]:

39.0


Radius: 5 km

Number of landcover classes:

6

Dominant landcover type:

130: grassland

Fraction of dominant landcover type [%]:

38.0


Radius: 10 km

Number of landcover classes:

7

Dominant landcover type:

10: cropland, rainfed

Fraction of dominant landcover type [%]:

31.0


Radius: 20 km

Number of landcover classes:

7

Dominant landcover type:

10: cropland, rainfed

Fraction of dominant landcover type [%]:

32.0


Disturbances


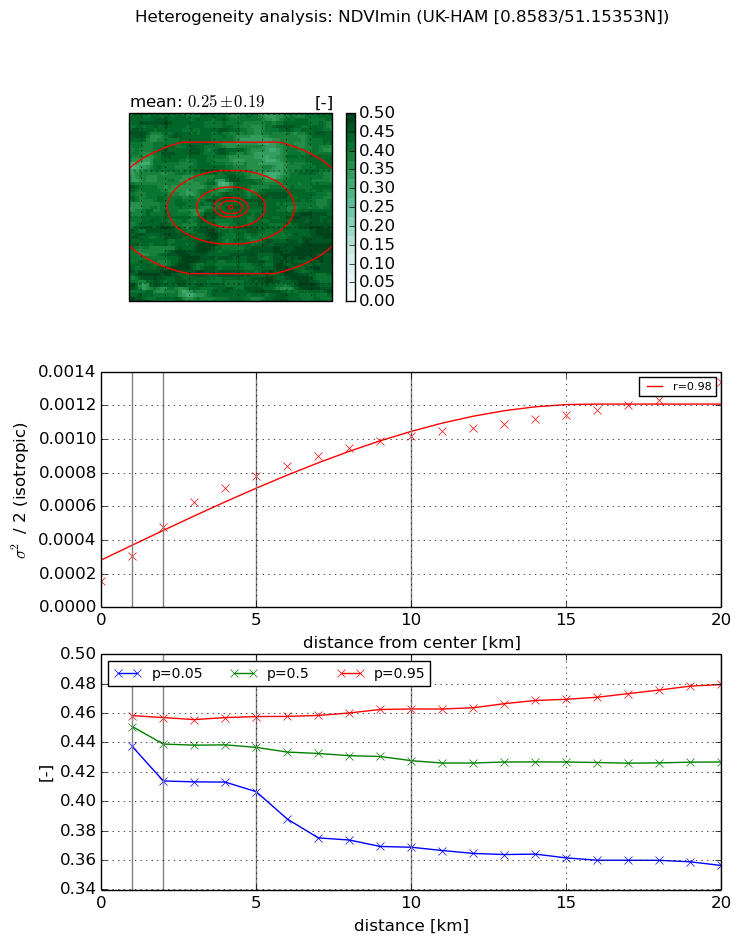
Heterogeneity analysis

The heterogeneity analysis provides information about the spatial and temporal heterogeneity of the site.

Topography


Roman et al. (2009) index


St

6.88517302614

Rcv

-0.0764695971109

Rse

0.0

Rst

0.0084293473218

Rsv

-0.35081995306


Height range @ 1km [m]

21

Height range @ 2km [m]

68

Height range @ 5km [m]

66

Height range @ 10km [m]

-999

Height range @ 20km [m]

-999


Variance slope @ 1 km

199

Variance slope @ 2 km

178

Variance slope @ 5 km

90

Variance slope @ 10 km

-999

Variance slope @ 20 km

-999


NDVI (max. NDVI composite)


Roman et al. (2009) index


St

1.43311579216

Rcv

0.689655427523

Rse

0.0

Rst

-0.403686193418

Rsv

-0.999999347332


NDVI range @ 1km [-]

0.02

NDVI range @ 2km [-]

0.06

NDVI range @ 5km [-]

0.09

NDVI range @ 10km [-]

0.13

NDVI range @ 20km [-]

0.16


Variance slope @ 1 km

0.000180192815346

Variance slope @ 2 km

0.000210523148432

Variance slope @ 5 km

0.000219244151644

Variance slope @ 10 km

0.00017846530235

Variance slope @ 20 km

0.000111074768358


NDVI (min. NDVI composite)I


Roman et al. (2009) index


St

0.594145237307

Rcv

0.414997848664

Rse

0.0

Rst

-0.610181070586

Rsv

4.02409154801


NDVI range @ 1km [-]

0.02

NDVI range @ 2km [-]

0.04

NDVI range @ 5km [-]

0.05

NDVI range @ 10km [-]

0.09

NDVI range @ 20km [-]

0.12


NDVI slope @ 1 km

0.000149294672716

NDVI slope @ 2 km

0.000162032198794

NDVI slope @ 5 km

0.000128258781263

NDVI slope @ 10 km

8.31045448195e-05

NDVI slope @ 20 km

4.85790859738e-05


Temporal stability analysis

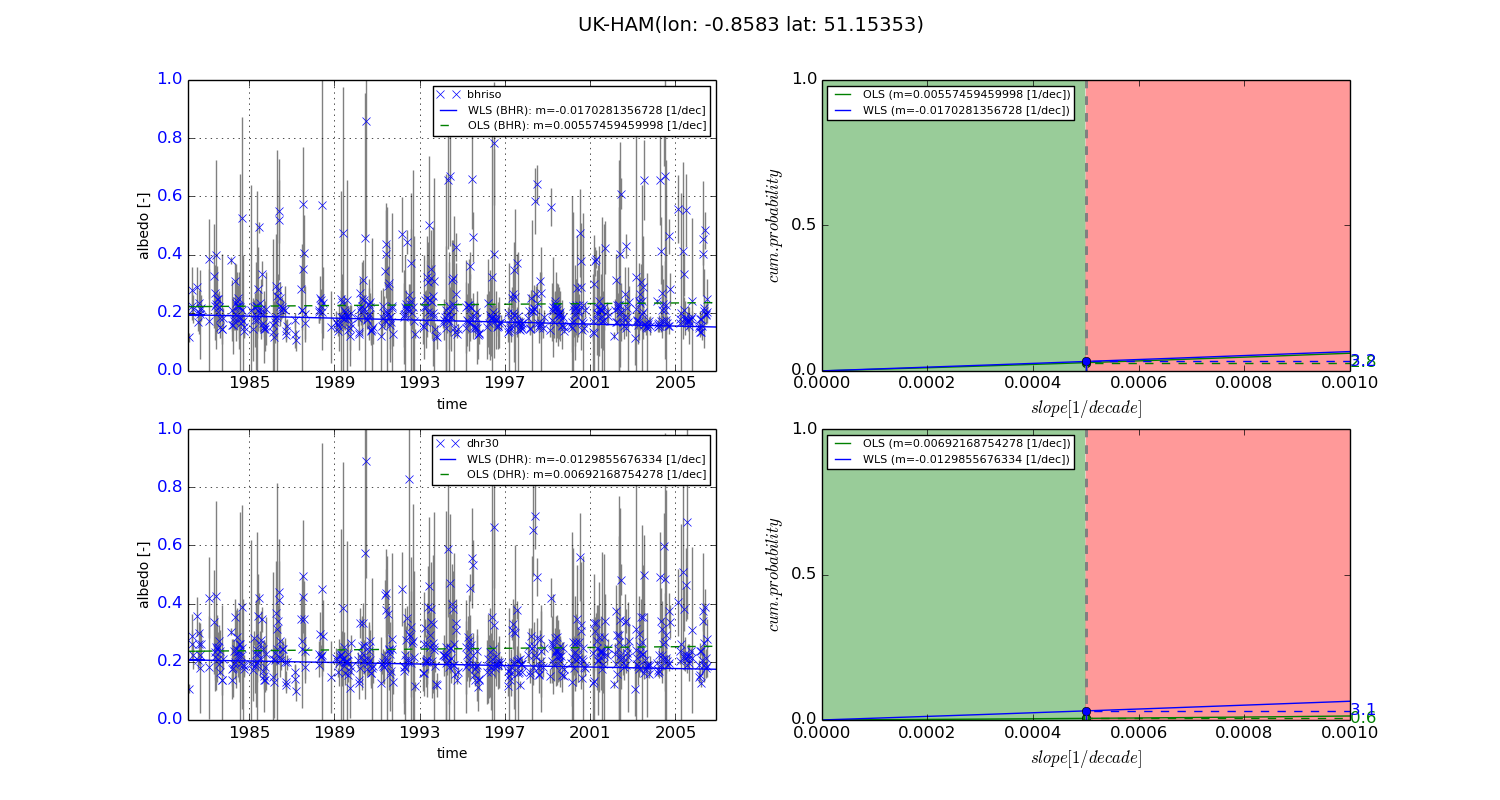
+000 deg (BHR)


BHR statistics

Temporal stability [1/decade]:


abs

rel


Weighted least square:

-0.0170281356728


Ordinary least square:

0.00557459459998


Probabilities that GCOS criteria is met:

Weighted least square:

3.2 %

Ordinary least square:

2.8 %


DHR statistics

Temporal stability [1/decade]:


abs

rel


Weighted least square:

-0.0129855676334


Ordinary least square:

0.00692168754278


Probabilities that GCOS criteria is met:

Weighted least square:

3.1 %

Ordinary least square:

0.6 %


+057/+063 deg (BHR)


BHR statistics

Temporal stability [1/decade]:


abs

rel


Weighted least square:

-99999.0


Ordinary least square:

-99999.0


Probabilities that GCOS criteria is met:

Weighted least square:

-99999.0 %

Ordinary least square:

-99999.0 %


DHR statistics

Temporal stability [1/decade]:


abs

rel


Weighted least square:

-99999.0


Ordinary least square:

-99999.0


Probabilities that GCOS criteria is met:

Weighted least square:

-99999.0 %

Ordinary least square:

-99999.0 %


Temporal anomaly analyis

The variance of the temporal anomalies provides an additional measure about the stability of the signal AFTER removal of the mean seasonal cylce.
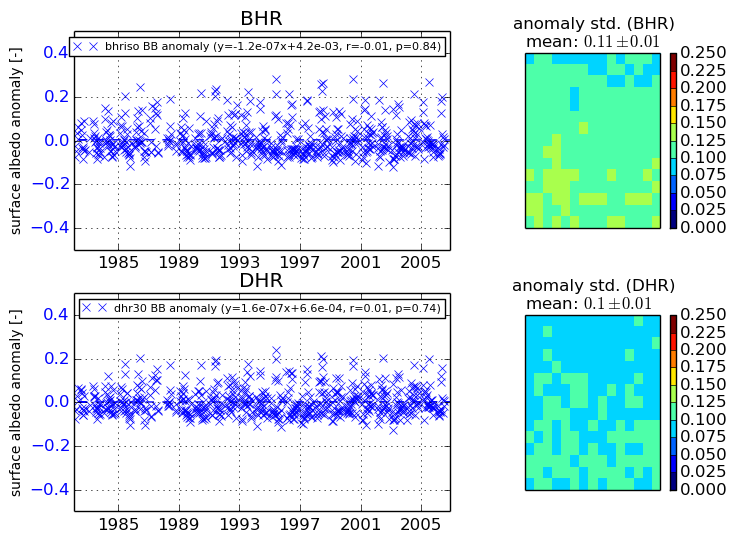
+000 deg


+057/+063 deg