UK-HER


Location

lon / lat [deg]: -0.4761 / 51.7838

Source network: FLUXNET


Geostationary surface albedo (GSA) data


“+000”


“+057/+063”


Landcover information (based on ESA CCI landcover data)


Landcover fractions @ 2km distance


Landcover fractions @ 20 km distance


Legend


Distance to open water bodies [km]:

10.3

Distance to urban areas [km]:

0.63


Radius: 1 km

Number of landcover classes:

2

Dominant landcover type:

10: cropland, rainfed

Fraction of dominant landcover type [%]:

88.0


Radius: 2 km

Number of landcover classes:

3

Dominant landcover type:

10: cropland, rainfed

Fraction of dominant landcover type [%]:

64.0


Radius: 5 km

Number of landcover classes:

3

Dominant landcover type:

10: cropland, rainfed

Fraction of dominant landcover type [%]:

57.0


Radius: 10 km

Number of landcover classes:

5

Dominant landcover type:

10: cropland, rainfed

Fraction of dominant landcover type [%]:

55.0


Radius: 20 km

Number of landcover classes:

3

Dominant landcover type:

10: cropland, rainfed

Fraction of dominant landcover type [%]:

49.0


Disturbances


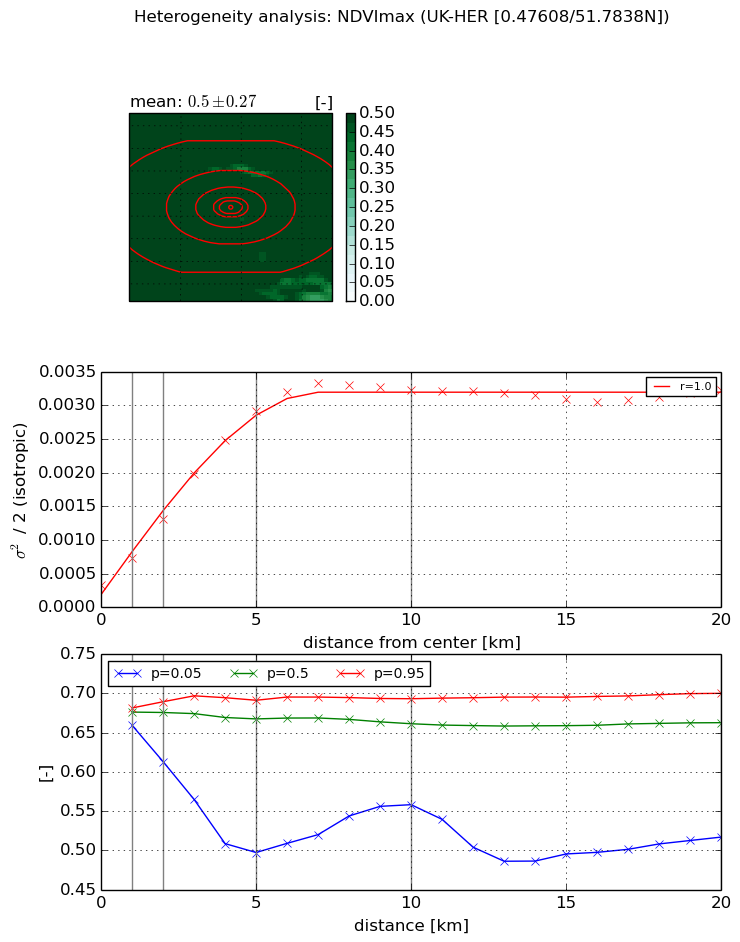
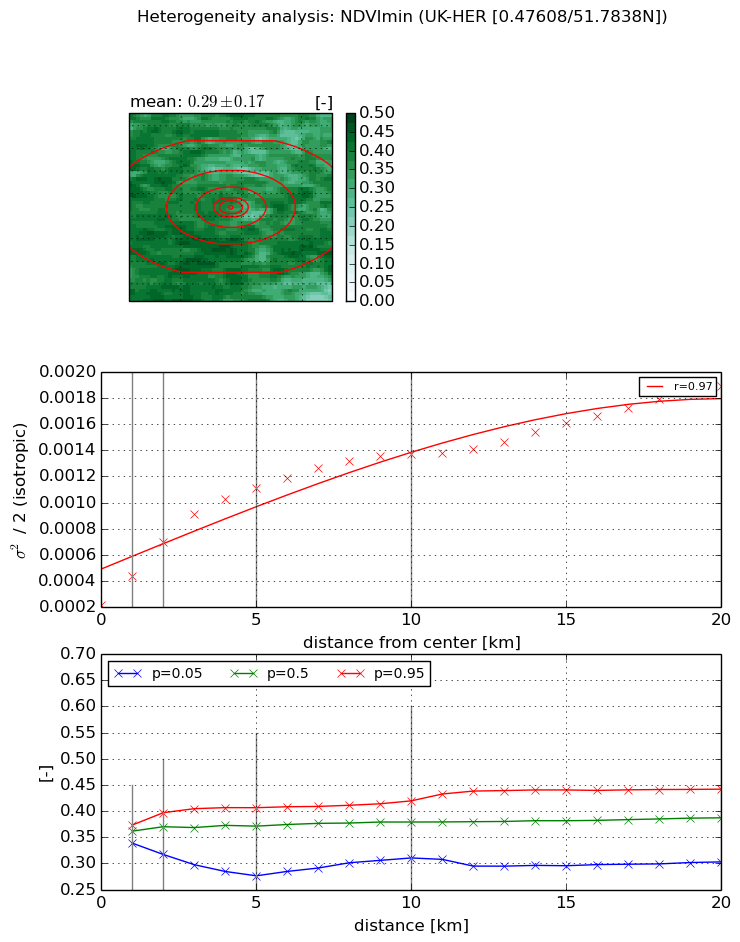
Heterogeneity analysis

The heterogeneity analysis provides information about the spatial and temporal heterogeneity of the site.

Topography


Roman et al. (2009) index


St

5.7706268347

Rcv

0.118980055411

Rse

0.0

Rst

-0.0599458733614

Rsv

0.340948269635


Height range @ 1km [m]

47

Height range @ 2km [m]

66

Height range @ 5km [m]

73

Height range @ 10km [m]

-999

Height range @ 20km [m]

-999


Variance slope @ 1 km

243

Variance slope @ 2 km

177

Variance slope @ 5 km

78

Variance slope @ 10 km

-999

Variance slope @ 20 km

-999


NDVI (max. NDVI composite)


Roman et al. (2009) index


St

2.33237012794

Rcv

0.250221715623

Rse

0.0

Rst

-0.895833146503

Rsv

0.140190388601


NDVI range @ 1km [-]

0.02

NDVI range @ 2km [-]

0.08

NDVI range @ 5km [-]

0.19

NDVI range @ 10km [-]

0.14

NDVI range @ 20km [-]

0.18


Variance slope @ 1 km

0.000399590690874

Variance slope @ 2 km

0.000492161054848

Variance slope @ 5 km

0.000539309565544

Variance slope @ 10 km

0.000309841301917

Variance slope @ 20 km

9.96905765021e-05


NDVI (min. NDVI composite)I


Roman et al. (2009) index


St

1.33956216401e-07

Rcv

0.127829706549

Rse

0.0

Rst

0.196673134159

Rsv

22395376.916


NDVI range @ 1km [-]

0.03

NDVI range @ 2km [-]

0.08

NDVI range @ 5km [-]

0.13

NDVI range @ 10km [-]

0.11

NDVI range @ 20km [-]

0.14


NDVI slope @ 1 km

0.000221877872927

NDVI slope @ 2 km

0.00023777400035

NDVI slope @ 5 km

0.000184474245776

NDVI slope @ 10 km

0.000110114807547

NDVI slope @ 20 km

6.79226709228e-05


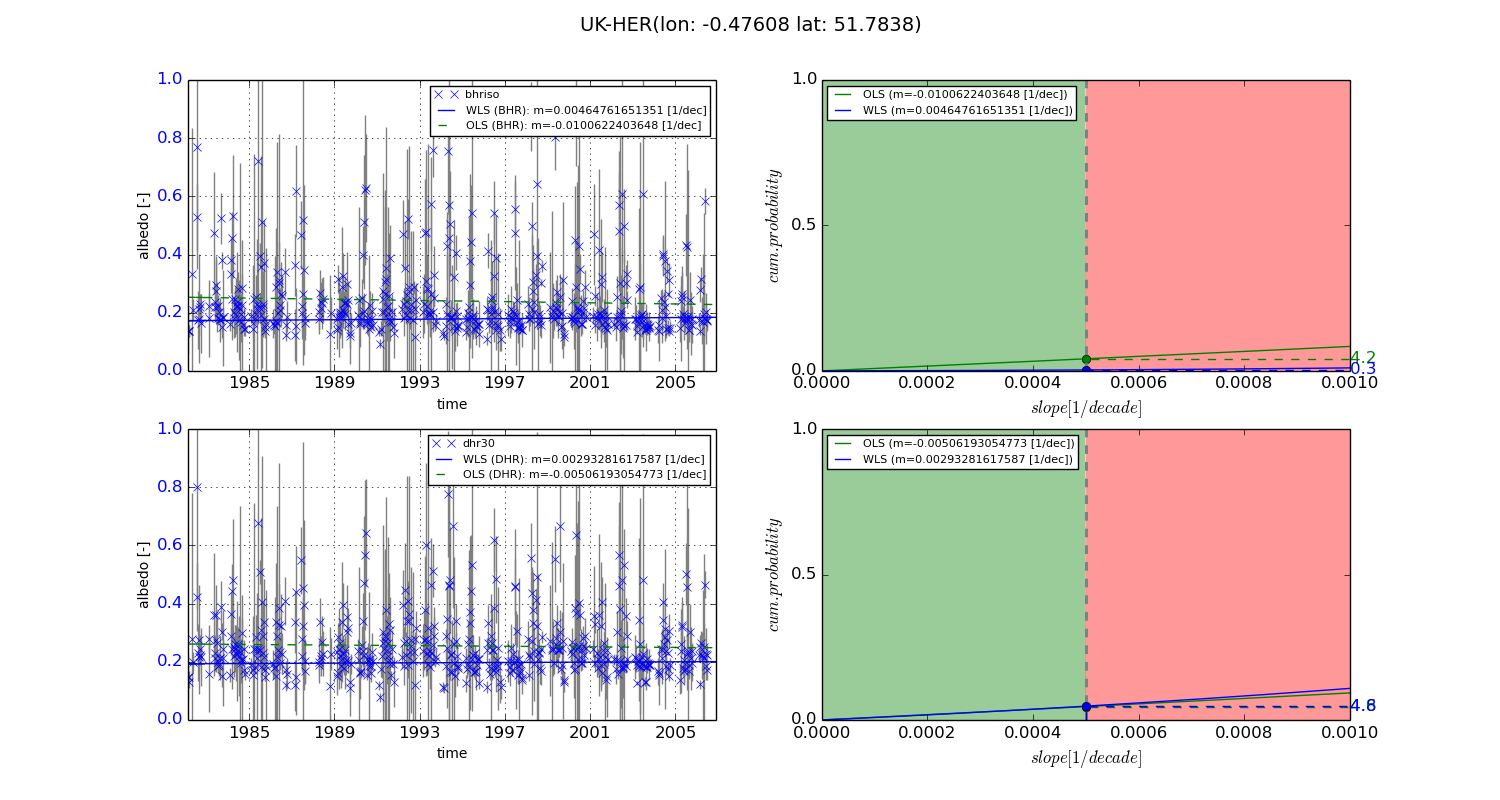
Temporal stability analysis

+000 deg (BHR)


BHR statistics

Temporal stability [1/decade]:


abs

rel


Weighted least square:

0.00464761651351


Ordinary least square:

-0.0100622403648


Probabilities that GCOS criteria is met:

Weighted least square:

0.3 %

Ordinary least square:

4.2 %


DHR statistics

Temporal stability [1/decade]:


abs

rel


Weighted least square:

0.00293281617587


Ordinary least square:

-0.00506193054773


Probabilities that GCOS criteria is met:

Weighted least square:

4.8 %

Ordinary least square:

4.6 %


+057/+063 deg (BHR)


BHR statistics

Temporal stability [1/decade]:


abs

rel


Weighted least square:

-99999.0


Ordinary least square:

-99999.0


Probabilities that GCOS criteria is met:

Weighted least square:

-99999.0 %

Ordinary least square:

-99999.0 %


DHR statistics

Temporal stability [1/decade]:


abs

rel


Weighted least square:

-99999.0


Ordinary least square:

-99999.0


Probabilities that GCOS criteria is met:

Weighted least square:

-99999.0 %

Ordinary least square:

-99999.0 %


Temporal anomaly analyis

The variance of the temporal anomalies provides an additional measure about the stability of the signal AFTER removal of the mean seasonal cylce.
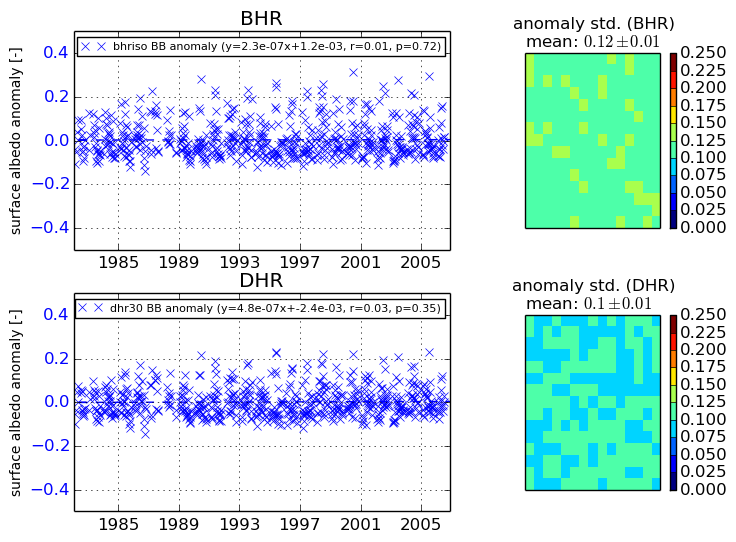
+000 deg


+057/+063 deg