UK-PL3


Location

lon / lat [deg]: -1.2667 / 51.45

Source network: FLUXNET


Geostationary surface albedo (GSA) data


“+000”


“+057/+063”


Landcover information (based on ESA CCI landcover data)


Landcover fractions @ 2km distance


Landcover fractions @ 20 km distance


Legend


Distance to open water bodies [km]:

8.16

Distance to urban areas [km]:

0.51


Radius: 1 km

Number of landcover classes:

6

Dominant landcover type:

70: Tree cover, needleleaved, evergreen, closed to open (>15%)

Fraction of dominant landcover type [%]:

50.0


Radius: 2 km

Number of landcover classes:

7

Dominant landcover type:

10: cropland, rainfed

Fraction of dominant landcover type [%]:

31.0


Radius: 5 km

Number of landcover classes:

6

Dominant landcover type:

10: cropland, rainfed

Fraction of dominant landcover type [%]:

52.0


Radius: 10 km

Number of landcover classes:

5

Dominant landcover type:

10: cropland, rainfed

Fraction of dominant landcover type [%]:

56.0


Radius: 20 km

Number of landcover classes:

5

Dominant landcover type:

10: cropland, rainfed

Fraction of dominant landcover type [%]:

62.0


Disturbances


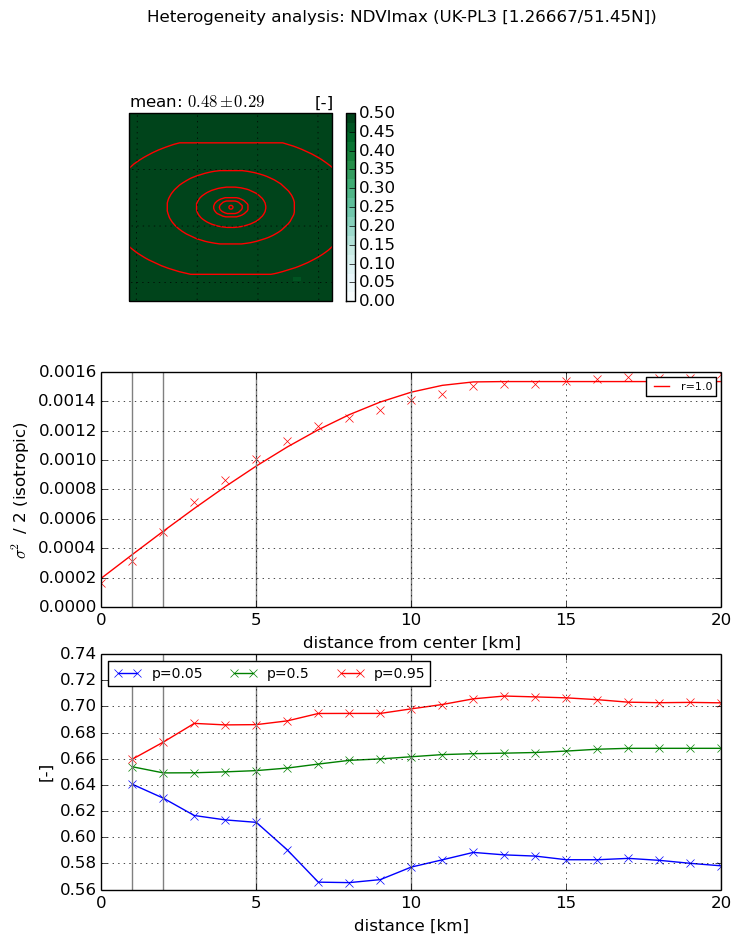
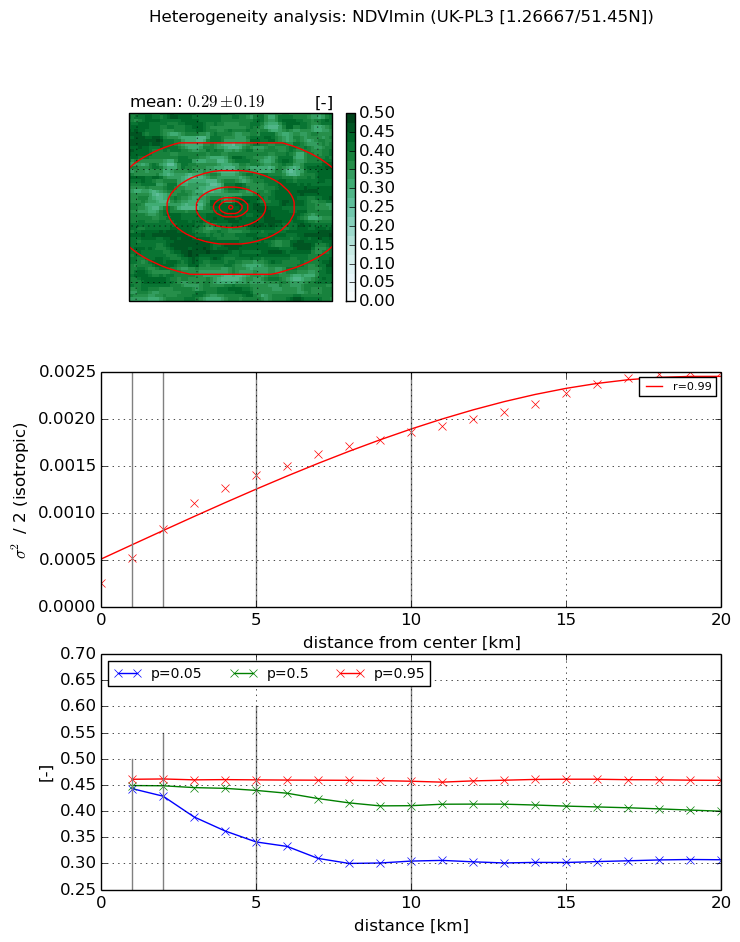
Heterogeneity analysis

The heterogeneity analysis provides information about the spatial and temporal heterogeneity of the site.

Topography


Roman et al. (2009) index


St

5.3271228008

Rcv

0.0988532368

Rse

0.0

Rst

-0.0955570791555

Rsv

0.368745464788


Height range @ 1km [m]

48

Height range @ 2km [m]

59

Height range @ 5km [m]

69

Height range @ 10km [m]

-999

Height range @ 20km [m]

-999


Variance slope @ 1 km

230

Variance slope @ 2 km

186

Variance slope @ 5 km

88

Variance slope @ 10 km

-999

Variance slope @ 20 km

-999


NDVI (max. NDVI composite)


Roman et al. (2009) index


St

2.00693494859

Rcv

0.179042355208

Rse

0.0

Rst

-0.315780559724

Rsv

-0.99999384637


NDVI range @ 1km [-]

0.02

NDVI range @ 2km [-]

0.04

NDVI range @ 5km [-]

0.07

NDVI range @ 10km [-]

0.12

NDVI range @ 20km [-]

0.12


Variance slope @ 1 km

0.000149279639544

Variance slope @ 2 km

0.000173538430423

Variance slope @ 5 km

0.000173190519482

Variance slope @ 10 km

0.000126839723576

Variance slope @ 20 km

6.41917258459e-05


NDVI (min. NDVI composite)I


Roman et al. (2009) index


St

1.68990324154

Rcv

0.525792831977

Rse

0.0

Rst

-0.249456958861

Rsv

-0.99999977745


NDVI range @ 1km [-]

0.02

NDVI range @ 2km [-]

0.03

NDVI range @ 5km [-]

0.12

NDVI range @ 10km [-]

0.15

NDVI range @ 20km [-]

0.15


NDVI slope @ 1 km

0.000264041605458

NDVI slope @ 2 km

0.000288869288217

NDVI slope @ 5 km

0.000235593762635

NDVI slope @ 10 km

0.000153926860004

NDVI slope @ 20 km

0.000101598478471


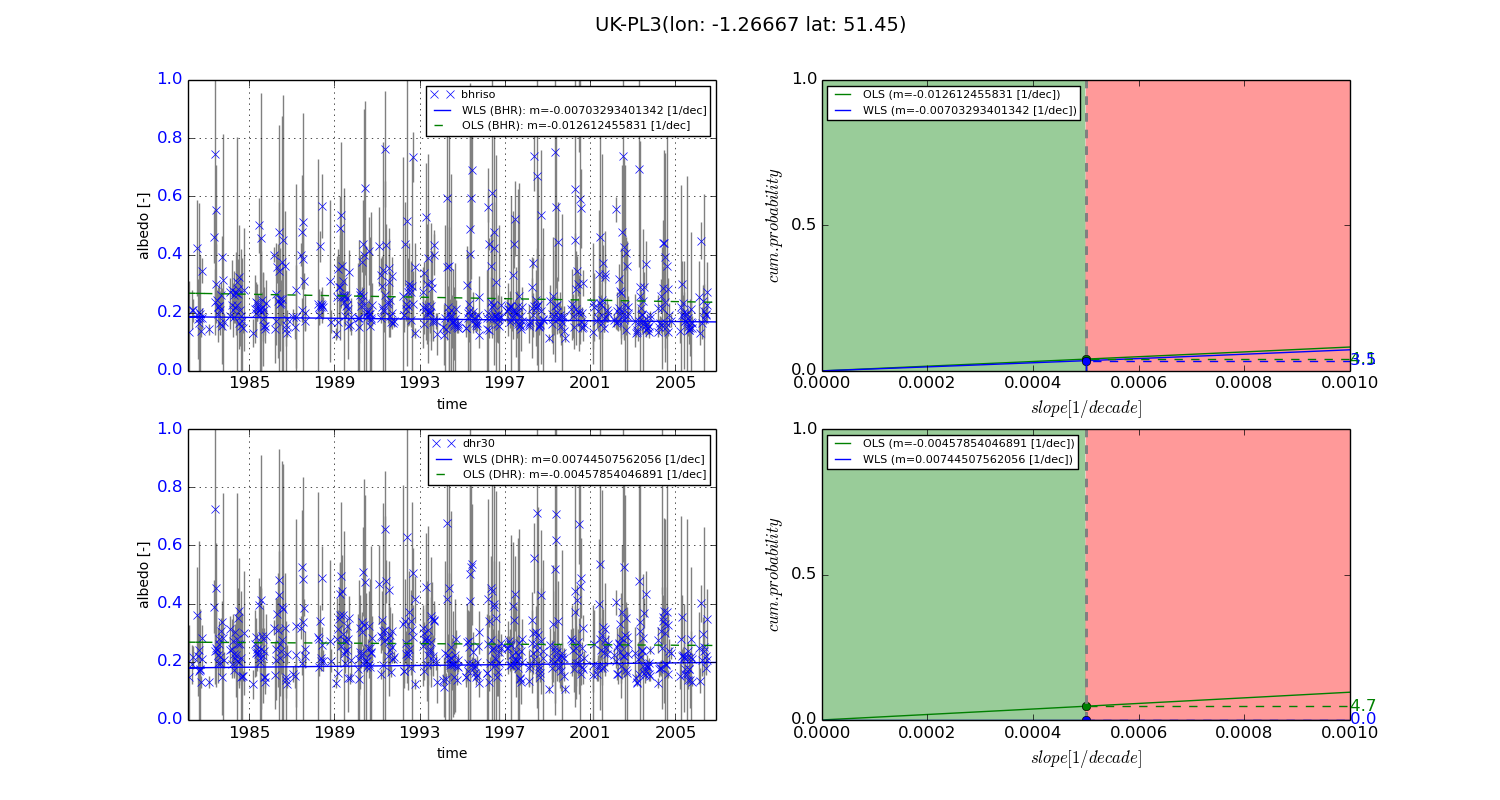
Temporal stability analysis

+000 deg (BHR)


BHR statistics

Temporal stability [1/decade]:


abs

rel


Weighted least square:

-0.00703293401342


Ordinary least square:

-0.012612455831


Probabilities that GCOS criteria is met:

Weighted least square:

3.5 %

Ordinary least square:

4.1 %


DHR statistics

Temporal stability [1/decade]:


abs

rel


Weighted least square:

0.00744507562056


Ordinary least square:

-0.00457854046891


Probabilities that GCOS criteria is met:

Weighted least square:

0.0 %

Ordinary least square:

4.7 %


+057/+063 deg (BHR)


BHR statistics

Temporal stability [1/decade]:


abs

rel


Weighted least square:

-99999.0


Ordinary least square:

-99999.0


Probabilities that GCOS criteria is met:

Weighted least square:

-99999.0 %

Ordinary least square:

-99999.0 %


DHR statistics

Temporal stability [1/decade]:


abs

rel


Weighted least square:

-99999.0


Ordinary least square:

-99999.0


Probabilities that GCOS criteria is met:

Weighted least square:

-99999.0 %

Ordinary least square:

-99999.0 %


Temporal anomaly analyis

The variance of the temporal anomalies provides an additional measure about the stability of the signal AFTER removal of the mean seasonal cylce.
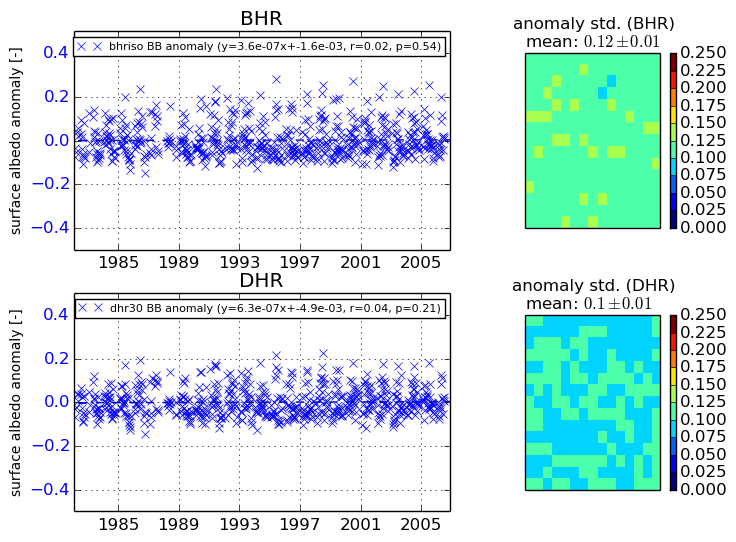
+000 deg


+057/+063 deg