UKIAH


Location

lon / lat [deg]: -118.9189 / 45.1336

Source network: AERONET


Geostationary surface albedo (GSA) data


“+000”


“+057/+063”


Landcover information (based on ESA CCI landcover data)


Landcover fractions @ 2km distance


Landcover fractions @ 20 km distance


Legend


Distance to open water bodies [km]:

0.34

Distance to urban areas [km]:

0.82


Radius: 1 km

Number of landcover classes:

4

Dominant landcover type:

130: grassland

Fraction of dominant landcover type [%]:

63.0


Radius: 2 km

Number of landcover classes:

4

Dominant landcover type:

130: grassland

Fraction of dominant landcover type [%]:

64.0


Radius: 5 km

Number of landcover classes:

3

Dominant landcover type:

130: grassland

Fraction of dominant landcover type [%]:

61.0


Radius: 10 km

Number of landcover classes:

3

Dominant landcover type:

130: grassland

Fraction of dominant landcover type [%]:

42.0


Radius: 20 km

Number of landcover classes:

3

Dominant landcover type:

70: Tree cover, needleleaved, evergreen, closed to open (>15%)

Fraction of dominant landcover type [%]:

66.0


Disturbances


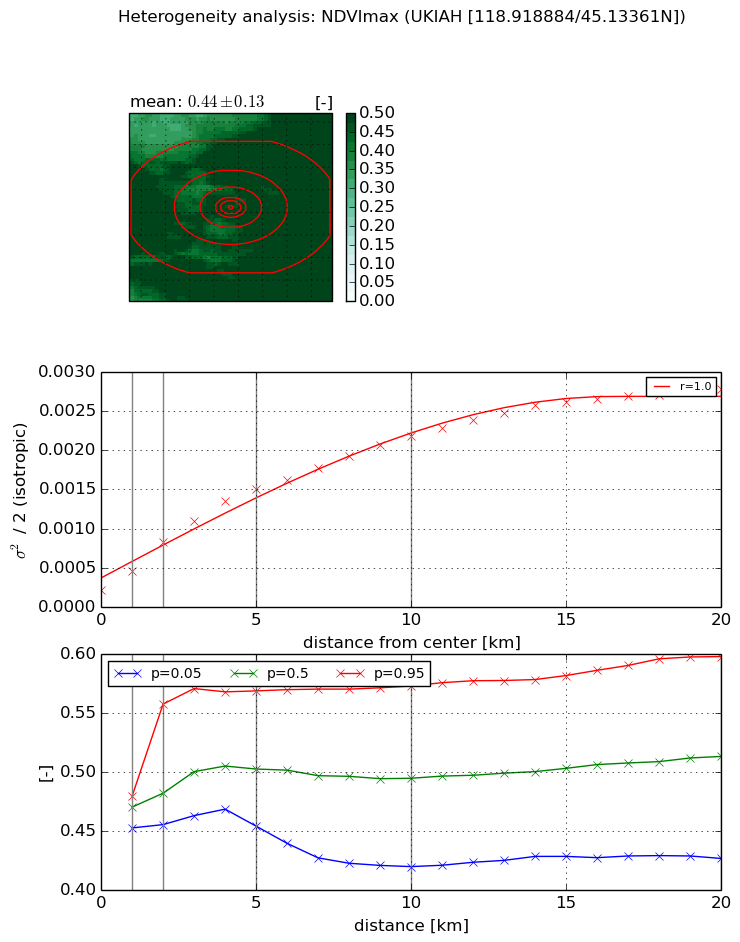
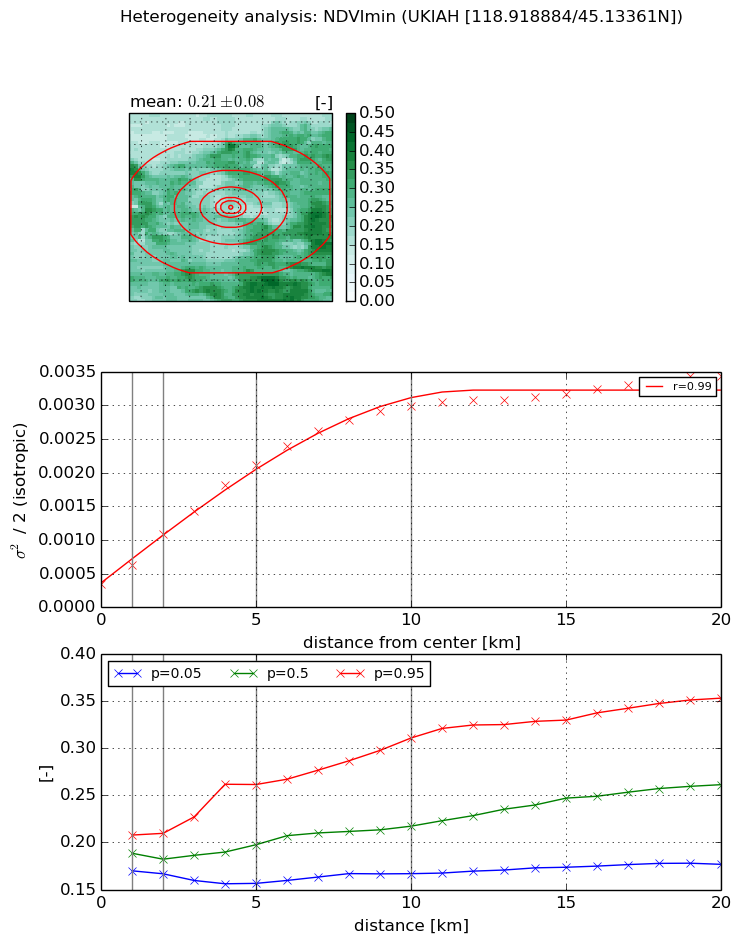
Heterogeneity analysis

The heterogeneity analysis provides information about the spatial and temporal heterogeneity of the site.

Topography


Roman et al. (2009) index


St

1.18712082951e-07

Rcv

0.903645803668

Rse

0.0

Rst

0.0763405534776

Rsv

25271226.0546


Height range @ 1km [m]

24

Height range @ 2km [m]

47

Height range @ 5km [m]

233

Height range @ 10km [m]

-999

Height range @ 20km [m]

-999


Variance slope @ 1 km

898

Variance slope @ 2 km

1147

Variance slope @ 5 km

1480

Variance slope @ 10 km

-999

Variance slope @ 20 km

-999


NDVI (max. NDVI composite)


Roman et al. (2009) index


St

6.22778083397

Rcv

-0.0360434816345

Rse

0.0

Rst

0.0921812956854

Rsv

-0.353487742754


NDVI range @ 1km [-]

0.03

NDVI range @ 2km [-]

0.1

NDVI range @ 5km [-]

0.11

NDVI range @ 10km [-]

0.15

NDVI range @ 20km [-]

0.17


Variance slope @ 1 km

0.000235658109626

Variance slope @ 2 km

0.000303733823246

Variance slope @ 5 km

0.00026886056862

Variance slope @ 10 km

0.000192536661553

Variance slope @ 20 km

0.000120283694129


NDVI (min. NDVI composite)I


Roman et al. (2009) index


St

3.11990085215

Rcv

0.333297852116

Rse

0.0

Rst

-0.13740093119

Rsv

0.490870235124


NDVI range @ 1km [-]

0.04

NDVI range @ 2km [-]

0.04

NDVI range @ 5km [-]

0.11

NDVI range @ 10km [-]

0.14

NDVI range @ 20km [-]

0.18


NDVI slope @ 1 km

0.000291289440861

NDVI slope @ 2 km

0.000374331285899

NDVI slope @ 5 km

0.000366835176812

NDVI slope @ 10 km

0.000277135980204

NDVI slope @ 20 km

0.000138344813144


Temporal stability analysis

+000 deg (BHR)


BHR statistics

Temporal stability [1/decade]:


abs

rel


Weighted least square:

None


Ordinary least square:

None


Probabilities that GCOS criteria is met:

Weighted least square:

None %

Ordinary least square:

None %


DHR statistics

Temporal stability [1/decade]:


abs

rel


Weighted least square:

None


Ordinary least square:

None


Probabilities that GCOS criteria is met:

Weighted least square:

None %

Ordinary least square:

None %


+057/+063 deg (BHR)


BHR statistics

Temporal stability [1/decade]:


abs

rel


Weighted least square:

None


Ordinary least square:

None


Probabilities that GCOS criteria is met:

Weighted least square:

None %

Ordinary least square:

None %


DHR statistics

Temporal stability [1/decade]:


abs

rel


Weighted least square:

None


Ordinary least square:

None


Probabilities that GCOS criteria is met:

Weighted least square:

None %

Ordinary least square:

None %


Temporal anomaly analyis

The variance of the temporal anomalies provides an additional measure about the stability of the signal AFTER removal of the mean seasonal cylce.

+000 deg


+057/+063 deg