UNIV_OF_HOUSTON


Location

lon / lat [deg]: -95.3416 / 29.7177

Source network: AERONET


Geostationary surface albedo (GSA) data


“+000”


“+057/+063”


Landcover information (based on ESA CCI landcover data)


Landcover fractions @ 2km distance


Landcover fractions @ 20 km distance


Legend


Distance to open water bodies [km]:

6.44

Distance to urban areas [km]:

0.13


Radius: 1 km

Number of landcover classes:

1

Dominant landcover type:

190: urban areas

Fraction of dominant landcover type [%]:

100.0


Radius: 2 km

Number of landcover classes:

1

Dominant landcover type:

190: urban areas

Fraction of dominant landcover type [%]:

100.0


Radius: 5 km

Number of landcover classes:

1

Dominant landcover type:

190: urban areas

Fraction of dominant landcover type [%]:

100.0


Radius: 10 km

Number of landcover classes:

2

Dominant landcover type:

190: urban areas

Fraction of dominant landcover type [%]:

97.0


Radius: 20 km

Number of landcover classes:

2

Dominant landcover type:

190: urban areas

Fraction of dominant landcover type [%]:

89.0


Disturbances


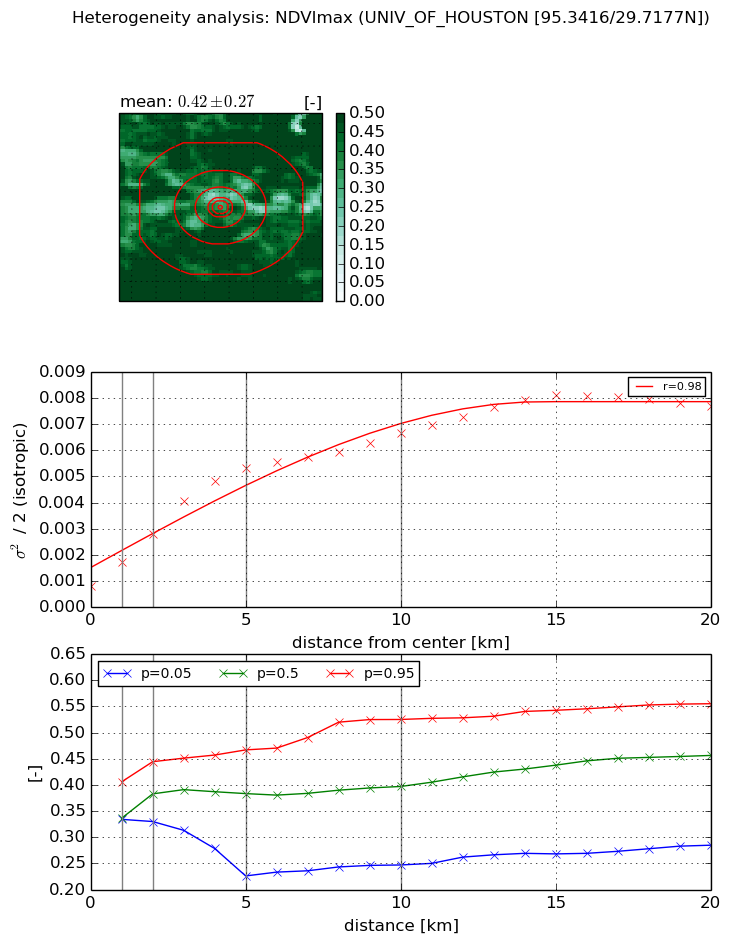
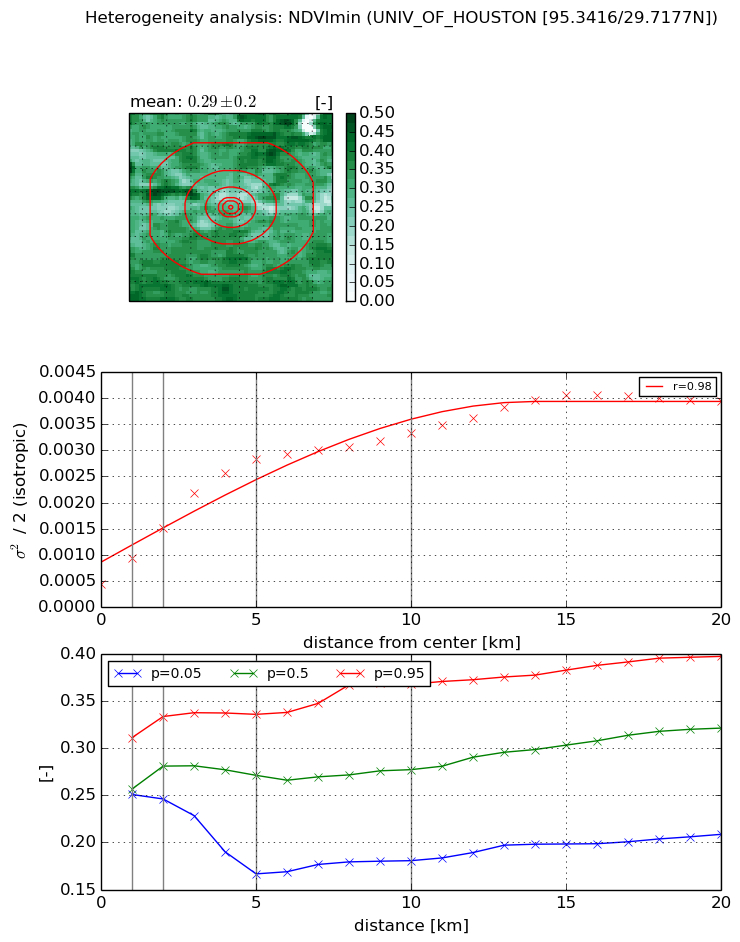
Heterogeneity analysis

The heterogeneity analysis provides information about the spatial and temporal heterogeneity of the site.

Topography


Roman et al. (2009) index


St

0.964127507285

Rcv

0.381709712041

Rse

0.0

Rst

1.72996309393

Rsv

-0.999948818064


Height range @ 1km [m]

11

Height range @ 2km [m]

10

Height range @ 5km [m]

11

Height range @ 10km [m]

-999

Height range @ 20km [m]

-999


Variance slope @ 1 km

10

Variance slope @ 2 km

4

Variance slope @ 5 km

2

Variance slope @ 10 km

-999

Variance slope @ 20 km

-999


NDVI (max. NDVI composite)


Roman et al. (2009) index


St

1.42040527538

Rcv

0.674829459197

Rse

0.0

Rst

-0.437257791645

Rsv

-0.999986008813


NDVI range @ 1km [-]

0.07

NDVI range @ 2km [-]

0.11

NDVI range @ 5km [-]

0.24

NDVI range @ 10km [-]

0.28

NDVI range @ 20km [-]

0.27


Variance slope @ 1 km

0.000896947286889

Variance slope @ 2 km

0.000990274299853

Variance slope @ 5 km

0.000946252921811

Variance slope @ 10 km

0.00055431996265

Variance slope @ 20 km

0.000317961418493


NDVI (min. NDVI composite)I


Roman et al. (2009) index


St

1.79600227445

Rcv

0.502024285983

Rse

0.0

Rst

-0.401235986162

Rsv

0.767116231652


NDVI range @ 1km [-]

0.06

NDVI range @ 2km [-]

0.09

NDVI range @ 5km [-]

0.17

NDVI range @ 10km [-]

0.19

NDVI range @ 20km [-]

0.19


NDVI slope @ 1 km

0.000485074278833

NDVI slope @ 2 km

0.000532927862889

NDVI slope @ 5 km

0.000500931496523

NDVI slope @ 10 km

0.00027365350042

NDVI slope @ 20 km

0.000153270689563


Temporal stability analysis

+000 deg (BHR)


BHR statistics

Temporal stability [1/decade]:


abs

rel


Weighted least square:

None


Ordinary least square:

None


Probabilities that GCOS criteria is met:

Weighted least square:

None %

Ordinary least square:

None %


DHR statistics

Temporal stability [1/decade]:


abs

rel


Weighted least square:

None


Ordinary least square:

None


Probabilities that GCOS criteria is met:

Weighted least square:

None %

Ordinary least square:

None %


+057/+063 deg (BHR)


BHR statistics

Temporal stability [1/decade]:


abs

rel


Weighted least square:

None


Ordinary least square:

None


Probabilities that GCOS criteria is met:

Weighted least square:

None %

Ordinary least square:

None %


DHR statistics

Temporal stability [1/decade]:


abs

rel


Weighted least square:

None


Ordinary least square:

None


Probabilities that GCOS criteria is met:

Weighted least square:

None %

Ordinary least square:

None %


Temporal anomaly analyis

The variance of the temporal anomalies provides an additional measure about the stability of the signal AFTER removal of the mean seasonal cylce.

+000 deg


+057/+063 deg