US-ARB


Location

lon / lat [deg]: -98.0402 / 35.5497

Source network: FLUXNET


Geostationary surface albedo (GSA) data


“+000”


“+057/+063”


Landcover information (based on ESA CCI landcover data)


Landcover fractions @ 2km distance


Landcover fractions @ 20 km distance


Legend


Distance to open water bodies [km]:

2.61

Distance to urban areas [km]:

5.54


Radius: 1 km

Number of landcover classes:

3

Dominant landcover type:

130: grassland

Fraction of dominant landcover type [%]:

61.0


Radius: 2 km

Number of landcover classes:

3

Dominant landcover type:

130: grassland

Fraction of dominant landcover type [%]:

74.0


Radius: 5 km

Number of landcover classes:

3

Dominant landcover type:

130: grassland

Fraction of dominant landcover type [%]:

72.0


Radius: 10 km

Number of landcover classes:

4

Dominant landcover type:

130: grassland

Fraction of dominant landcover type [%]:

68.0


Radius: 20 km

Number of landcover classes:

4

Dominant landcover type:

130: grassland

Fraction of dominant landcover type [%]:

71.0


Disturbances


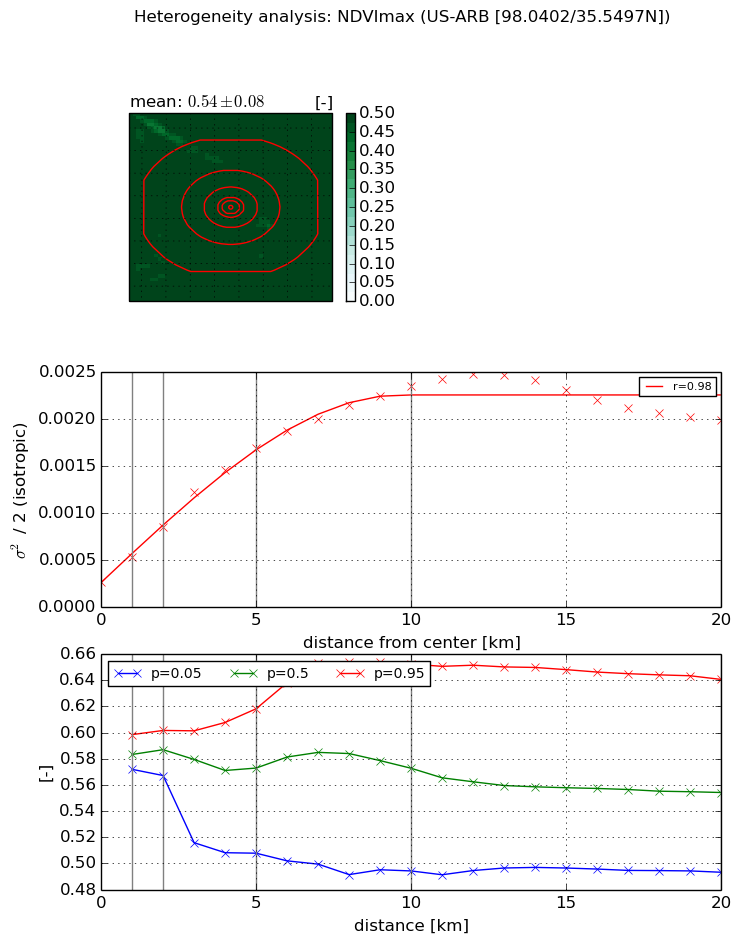
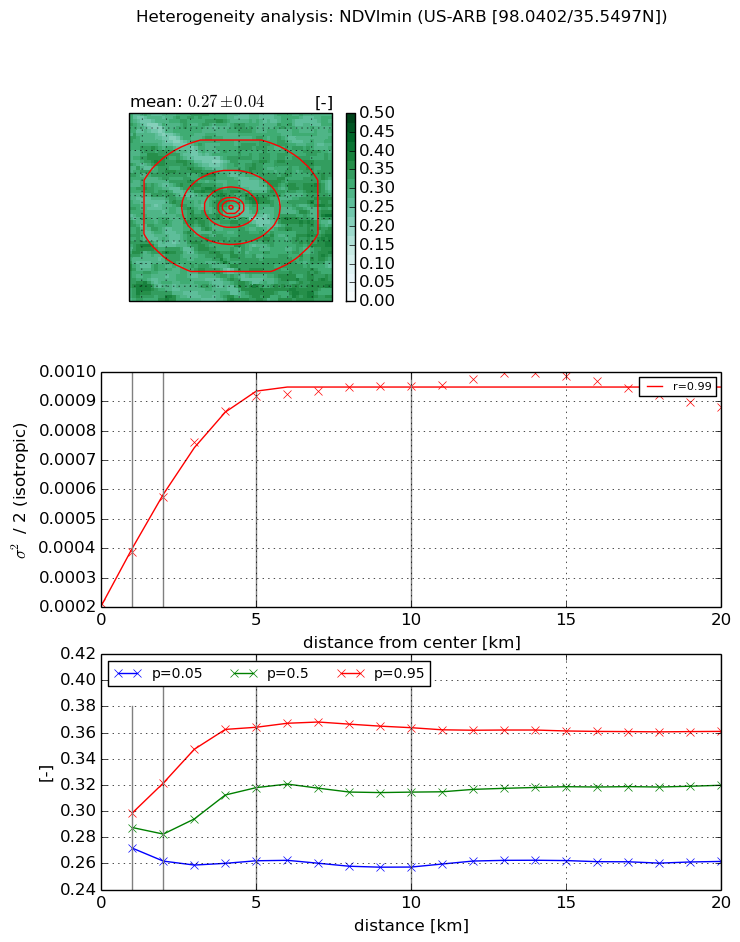
Heterogeneity analysis

The heterogeneity analysis provides information about the spatial and temporal heterogeneity of the site.

Topography


Roman et al. (2009) index


St

0.0493247912299

Rcv

0.497532151474

Rse

0.0

Rst

2.57151263288e-07

Rsv

60.3238096628


Height range @ 1km [m]

15

Height range @ 2km [m]

18

Height range @ 5km [m]

30

Height range @ 10km [m]

-999

Height range @ 20km [m]

-999


Variance slope @ 1 km

15

Variance slope @ 2 km

14

Variance slope @ 5 km

17

Variance slope @ 10 km

-999

Variance slope @ 20 km

-999


NDVI (max. NDVI composite)


Roman et al. (2009) index


St

1.97120536099

Rcv

0.325753355998

Rse

0.0

Rst

-0.196158331649

Rsv

-0.99999975769


NDVI range @ 1km [-]

0.03

NDVI range @ 2km [-]

0.03

NDVI range @ 5km [-]

0.11

NDVI range @ 10km [-]

0.16

NDVI range @ 20km [-]

0.15


Variance slope @ 1 km

0.000269171735163

Variance slope @ 2 km

0.000295524747802

Variance slope @ 5 km

0.000294786547538

Variance slope @ 10 km

0.000210038593618

Variance slope @ 20 km

7.59413907377e-05


NDVI (min. NDVI composite)I


Roman et al. (2009) index


St

1.28982047628e-07

Rcv

0.0517213400217

Rse

0.0

Rst

0.379255963378

Rsv

23259050.384


NDVI range @ 1km [-]

0.03

NDVI range @ 2km [-]

0.06

NDVI range @ 5km [-]

0.1

NDVI range @ 10km [-]

0.11

NDVI range @ 20km [-]

0.1


NDVI slope @ 1 km

0.000174994052153

NDVI slope @ 2 km

0.000180533012792

NDVI slope @ 5 km

0.000146951690005

NDVI slope @ 10 km

6.80147103738e-05

NDVI slope @ 20 km

2.18463758918e-05


Temporal stability analysis

+000 deg (BHR)


BHR statistics

Temporal stability [1/decade]:


abs

rel


Weighted least square:

None


Ordinary least square:

None


Probabilities that GCOS criteria is met:

Weighted least square:

None %

Ordinary least square:

None %


DHR statistics

Temporal stability [1/decade]:


abs

rel


Weighted least square:

None


Ordinary least square:

None


Probabilities that GCOS criteria is met:

Weighted least square:

None %

Ordinary least square:

None %


+057/+063 deg (BHR)


BHR statistics

Temporal stability [1/decade]:


abs

rel


Weighted least square:

None


Ordinary least square:

None


Probabilities that GCOS criteria is met:

Weighted least square:

None %

Ordinary least square:

None %


DHR statistics

Temporal stability [1/decade]:


abs

rel


Weighted least square:

None


Ordinary least square:

None


Probabilities that GCOS criteria is met:

Weighted least square:

None %

Ordinary least square:

None %


Temporal anomaly analyis

The variance of the temporal anomalies provides an additional measure about the stability of the signal AFTER removal of the mean seasonal cylce.

+000 deg


+057/+063 deg