US-AUD


Location

lon / lat [deg]: -110.51 / 31.5907

Source network: FLUXNET


Geostationary surface albedo (GSA) data


“+000”


“+057/+063”


Landcover information (based on ESA CCI landcover data)


Landcover fractions @ 2km distance


Landcover fractions @ 20 km distance


Legend


Distance to open water bodies [km]:

13.33

Distance to urban areas [km]:

13.58


Radius: 1 km

Number of landcover classes:

1

Dominant landcover type:

120: Shrubland

Fraction of dominant landcover type [%]:

100.0


Radius: 2 km

Number of landcover classes:

1

Dominant landcover type:

120: Shrubland

Fraction of dominant landcover type [%]:

100.0


Radius: 5 km

Number of landcover classes:

2

Dominant landcover type:

120: Shrubland

Fraction of dominant landcover type [%]:

97.0


Radius: 10 km

Number of landcover classes:

4

Dominant landcover type:

120: Shrubland

Fraction of dominant landcover type [%]:

87.0


Radius: 20 km

Number of landcover classes:

3

Dominant landcover type:

120: Shrubland

Fraction of dominant landcover type [%]:

75.0


Disturbances


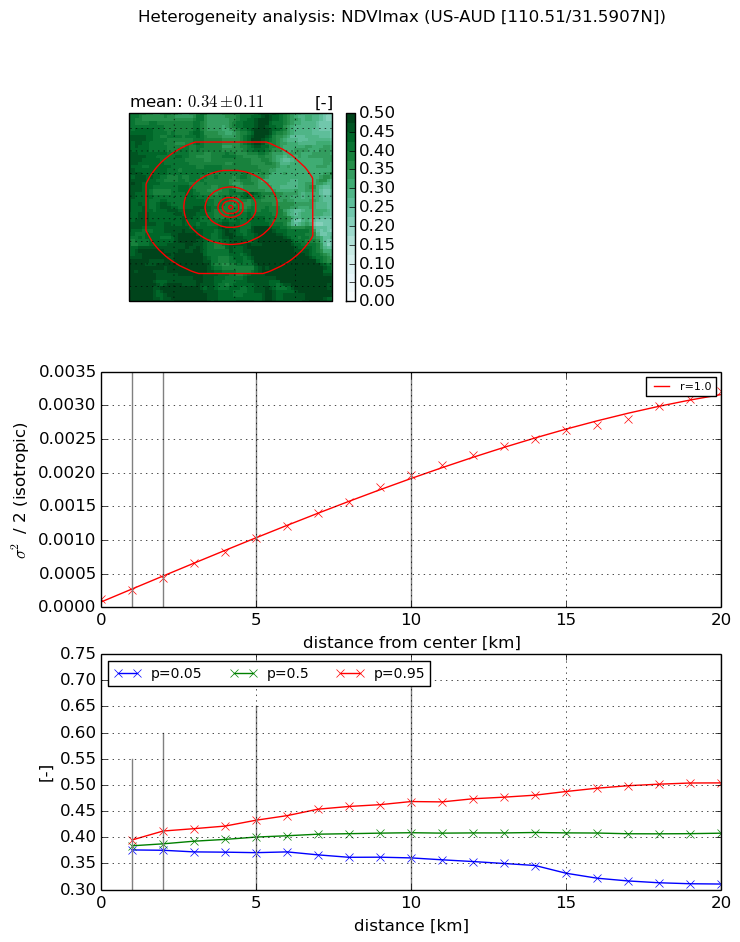
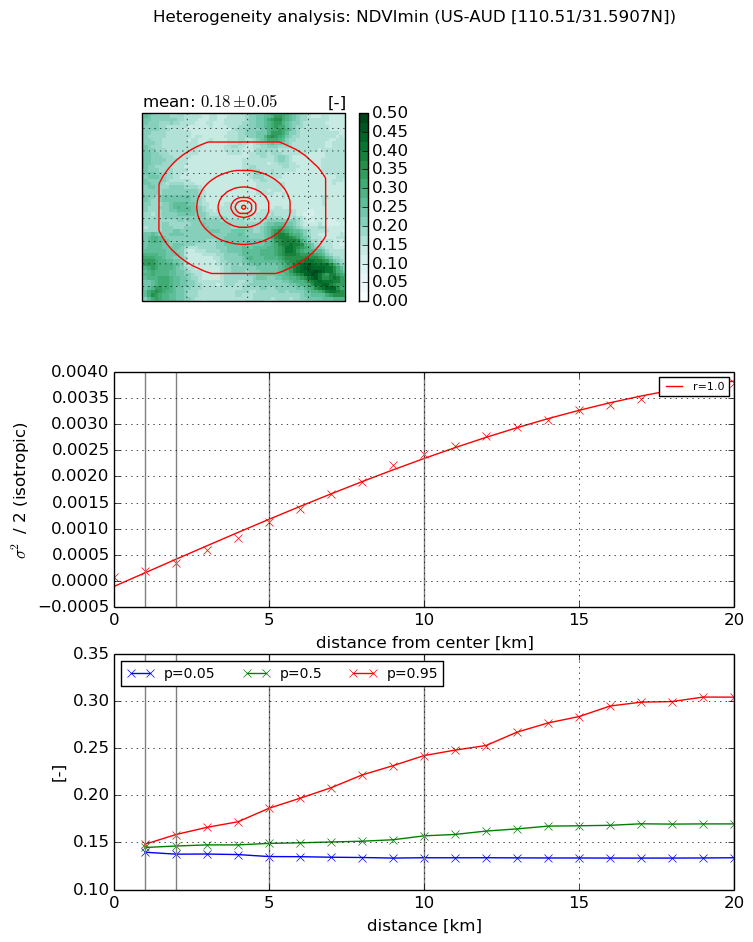
Heterogeneity analysis

The heterogeneity analysis provides information about the spatial and temporal heterogeneity of the site.

Topography


Roman et al. (2009) index


St

2.08398180494

Rcv

0.406952295704

Rse

0.0

Rst

0.0326645485429

Rsv

-0.999935071652


Height range @ 1km [m]

47

Height range @ 2km [m]

74

Height range @ 5km [m]

114

Height range @ 10km [m]

-999

Height range @ 20km [m]

-999


Variance slope @ 1 km

251

Variance slope @ 2 km

247

Variance slope @ 5 km

270

Variance slope @ 10 km

-999

Variance slope @ 20 km

-999


NDVI (max. NDVI composite)


Roman et al. (2009) index


St

3.05195305907

Rcv

0.331697433988

Rse

0.0

Rst

-0.214877997493

Rsv

0.436401679221


NDVI range @ 1km [-]

0.02

NDVI range @ 2km [-]

0.04

NDVI range @ 5km [-]

0.06

NDVI range @ 10km [-]

0.11

NDVI range @ 20km [-]

0.19


Variance slope @ 1 km

0.000144143212057

Variance slope @ 2 km

0.000156422129299

Variance slope @ 5 km

0.000184313226048

Variance slope @ 10 km

0.000187983837199

Variance slope @ 20 km

0.000157621869774


NDVI (min. NDVI composite)I


Roman et al. (2009) index


St

1.73513732722

Rcv

0.741321777227

Rse

0.0

Rst

-7.76597744524e-06

Rsv

-0.987640235121


NDVI range @ 1km [-]

0.01

NDVI range @ 2km [-]

0.02

NDVI range @ 5km [-]

0.05

NDVI range @ 10km [-]

0.11

NDVI range @ 20km [-]

0.17


NDVI slope @ 1 km

0.000112440206931

NDVI slope @ 2 km

0.000132600598294

NDVI slope @ 5 km

0.00021128762654

NDVI slope @ 10 km

0.000247688042275

NDVI slope @ 20 km

0.000201828264134


Temporal stability analysis

+000 deg (BHR)


BHR statistics

Temporal stability [1/decade]:


abs

rel


Weighted least square:

None


Ordinary least square:

None


Probabilities that GCOS criteria is met:

Weighted least square:

None %

Ordinary least square:

None %


DHR statistics

Temporal stability [1/decade]:


abs

rel


Weighted least square:

None


Ordinary least square:

None


Probabilities that GCOS criteria is met:

Weighted least square:

None %

Ordinary least square:

None %


+057/+063 deg (BHR)


BHR statistics

Temporal stability [1/decade]:


abs

rel


Weighted least square:

None


Ordinary least square:

None


Probabilities that GCOS criteria is met:

Weighted least square:

None %

Ordinary least square:

None %


DHR statistics

Temporal stability [1/decade]:


abs

rel


Weighted least square:

None


Ordinary least square:

None


Probabilities that GCOS criteria is met:

Weighted least square:

None %

Ordinary least square:

None %


Temporal anomaly analyis

The variance of the temporal anomalies provides an additional measure about the stability of the signal AFTER removal of the mean seasonal cylce.

+000 deg


+057/+063 deg