US-BAR


Location

lon / lat [deg]: -71.2881 / 44.0646

Source network: FLUXNET


Geostationary surface albedo (GSA) data


“+000”


“+057/+063”


Landcover information (based on ESA CCI landcover data)


Landcover fractions @ 2km distance


Landcover fractions @ 20 km distance


Legend


Distance to open water bodies [km]:

2.66

Distance to urban areas [km]:

0.85


Radius: 1 km

Number of landcover classes:

4

Dominant landcover type:

90: Tree cover, mixed leaf type

Fraction of dominant landcover type [%]:

53.0


Radius: 2 km

Number of landcover classes:

7

Dominant landcover type:

90: Tree cover, mixed leaf type

Fraction of dominant landcover type [%]:

49.0


Radius: 5 km

Number of landcover classes:

8

Dominant landcover type:

61: Tree cover, broadleaved, decidous (closed > 40%)

Fraction of dominant landcover type [%]:

38.0


Radius: 10 km

Number of landcover classes:

7

Dominant landcover type:

61: Tree cover, broadleaved, decidous (closed > 40%)

Fraction of dominant landcover type [%]:

43.0


Radius: 20 km

Number of landcover classes:

7

Dominant landcover type:

70: Tree cover, needleleaved, evergreen, closed to open (>15%)

Fraction of dominant landcover type [%]:

35.0


Disturbances


Heterogeneity analysis

The heterogeneity analysis provides information about the spatial and temporal heterogeneity of the site.

Topography


Roman et al. (2009) index


St

1.52666970939e-06

Rcv

0.0384265185172

Rse

0.0

Rst

0.0590504355153

Rsv

1965061.48824


Height range @ 1km [m]

79

Height range @ 2km [m]

206

Height range @ 5km [m]

567

Height range @ 10km [m]

-999

Height range @ 20km [m]

-999


Variance slope @ 1 km

9038

Variance slope @ 2 km

10143

Variance slope @ 5 km

8174

Variance slope @ 10 km

-999

Variance slope @ 20 km

-999


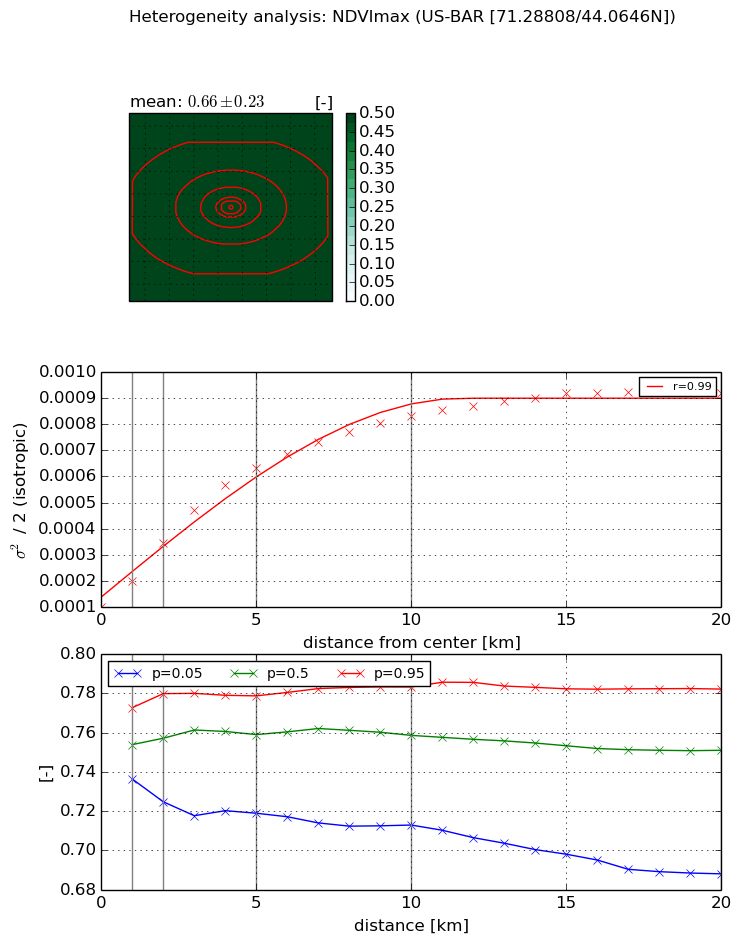
NDVI (max. NDVI composite)


Roman et al. (2009) index


St

nan

Rcv

nan

Rse

nan

Rst

nan

Rsv

nan


NDVI range @ 1km [-]

0.04

NDVI range @ 2km [-]

0.06

NDVI range @ 5km [-]

0.06

NDVI range @ 10km [-]

0.07

NDVI range @ 20km [-]

0.09


Variance slope @ 1 km

9.9373778349e-05

Variance slope @ 2 km

0.000121357274248

Variance slope @ 5 km

0.00011109546536

Variance slope @ 10 km

7.26195837842e-05

Variance slope @ 20 km

3.57925718315e-05


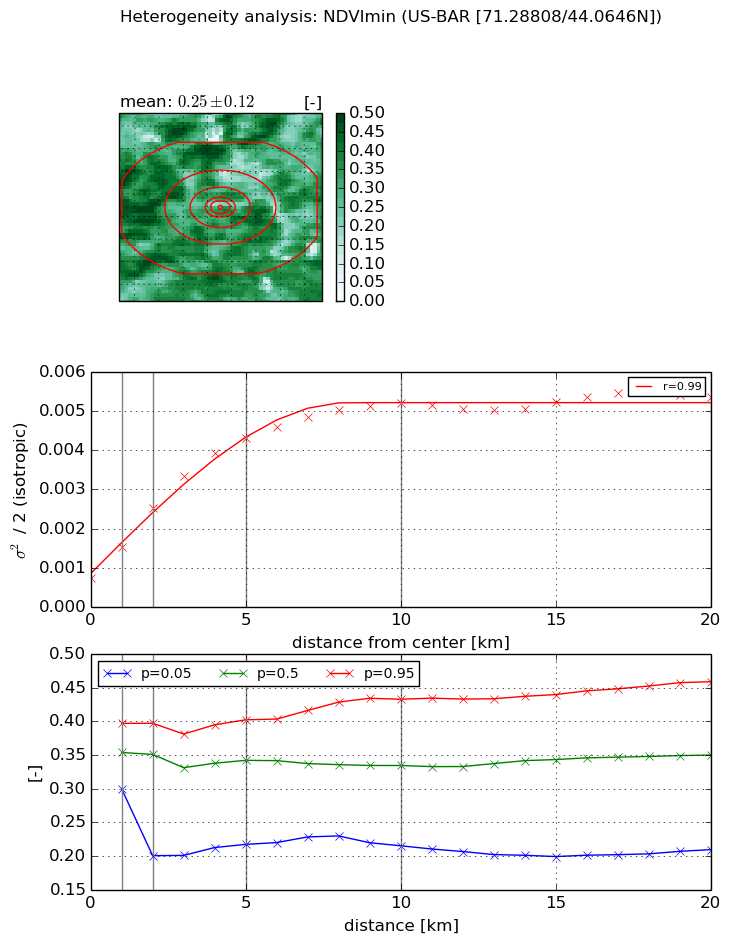
NDVI (min. NDVI composite)I


Roman et al. (2009) index


St

1.72360591551

Rcv

-0.175532761899

Rse

0.0

Rst

-0.525125035692

Rsv

1.0398792782


NDVI range @ 1km [-]

0.1

NDVI range @ 2km [-]

0.2

NDVI range @ 5km [-]

0.19

NDVI range @ 10km [-]

0.22

NDVI range @ 20km [-]

0.25


NDVI slope @ 1 km

0.000771081687885

NDVI slope @ 2 km

0.000891545102733

NDVI slope @ 5 km

0.000736074936845

NDVI slope @ 10 km

0.00043440026344

NDVI slope @ 20 km

0.000175509984134


Temporal stability analysis

+000 deg (BHR)


BHR statistics

Temporal stability [1/decade]:


abs

rel


Weighted least square:

-99999.0


Ordinary least square:

-99999.0


Probabilities that GCOS criteria is met:

Weighted least square:

-99999.0 %

Ordinary least square:

-99999.0 %


DHR statistics

Temporal stability [1/decade]:


abs

rel


Weighted least square:

-99999.0


Ordinary least square:

-99999.0


Probabilities that GCOS criteria is met:

Weighted least square:

-99999.0 %

Ordinary least square:

-99999.0 %


+057/+063 deg (BHR)


BHR statistics

Temporal stability [1/decade]:


abs

rel


Weighted least square:

None


Ordinary least square:

None


Probabilities that GCOS criteria is met:

Weighted least square:

None %

Ordinary least square:

None %


DHR statistics

Temporal stability [1/decade]:


abs

rel


Weighted least square:

None


Ordinary least square:

None


Probabilities that GCOS criteria is met:

Weighted least square:

None %

Ordinary least square:

None %


Temporal anomaly analyis

The variance of the temporal anomalies provides an additional measure about the stability of the signal AFTER removal of the mean seasonal cylce.

+000 deg


+057/+063 deg