US-BKG


Location

lon / lat [deg]: -96.8362 / 44.3453

Source network: FLUXNET


Geostationary surface albedo (GSA) data


“+000”


“+057/+063”


Landcover information (based on ESA CCI landcover data)


Landcover fractions @ 2km distance


Landcover fractions @ 20 km distance


Legend


Distance to open water bodies [km]:

8.97

Distance to urban areas [km]:

3.96


Radius: 1 km

Number of landcover classes:

3

Dominant landcover type:

10: cropland, rainfed

Fraction of dominant landcover type [%]:

67.0


Radius: 2 km

Number of landcover classes:

3

Dominant landcover type:

10: cropland, rainfed

Fraction of dominant landcover type [%]:

65.0


Radius: 5 km

Number of landcover classes:

4

Dominant landcover type:

10: cropland, rainfed

Fraction of dominant landcover type [%]:

48.0


Radius: 10 km

Number of landcover classes:

4

Dominant landcover type:

10: cropland, rainfed

Fraction of dominant landcover type [%]:

53.0


Radius: 20 km

Number of landcover classes:

5

Dominant landcover type:

10: cropland, rainfed

Fraction of dominant landcover type [%]:

62.0


Disturbances


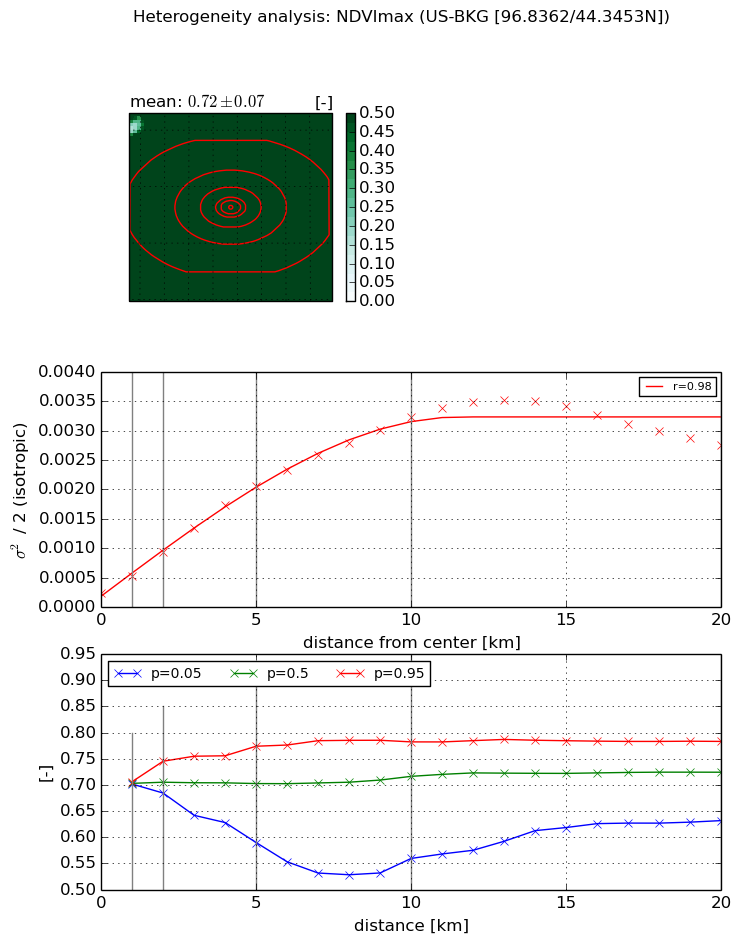
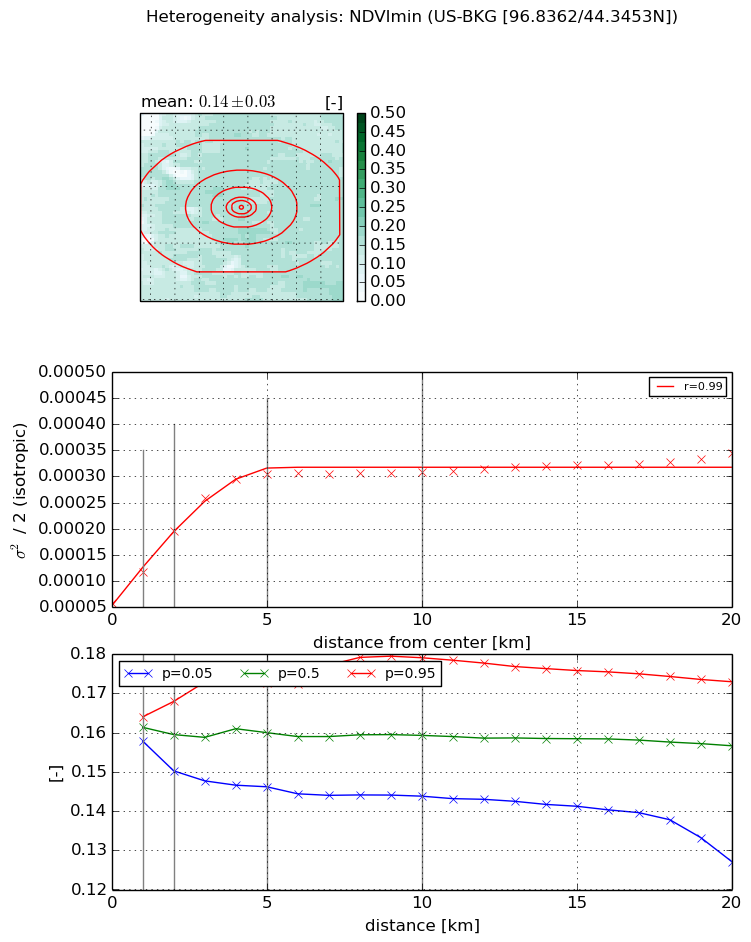
Heterogeneity analysis

The heterogeneity analysis provides information about the spatial and temporal heterogeneity of the site.

Topography


Roman et al. (2009) index


St

2.49339245359

Rcv

0.0959788623102

Rse

0.0

Rst

-0.107201229739

Rsv

-0.999999935097


Height range @ 1km [m]

16

Height range @ 2km [m]

22

Height range @ 5km [m]

26

Height range @ 10km [m]

-999

Height range @ 20km [m]

-999


Variance slope @ 1 km

12

Variance slope @ 2 km

14

Variance slope @ 5 km

13

Variance slope @ 10 km

-999

Variance slope @ 20 km

-999


NDVI (max. NDVI composite)


Roman et al. (2009) index


St

1.59677141577

Rcv

0.715674130287

Rse

0.0

Rst

-0.163117148462

Rsv

-0.999999868419


NDVI range @ 1km [-]

0.0

NDVI range @ 2km [-]

0.06

NDVI range @ 5km [-]

0.18

NDVI range @ 10km [-]

0.22

NDVI range @ 20km [-]

0.15


Variance slope @ 1 km

0.000282260011254

Variance slope @ 2 km

0.000348661444635

Variance slope @ 5 km

0.000374997362343

Variance slope @ 10 km

0.000304297453235

Variance slope @ 20 km

0.000130268407236


NDVI (min. NDVI composite)I


Roman et al. (2009) index


St

17.767843586

Rcv

0.052563801199

Rse

0.0

Rst

-0.050695031618

Rsv

-0.0655855171169


NDVI range @ 1km [-]

0.01

NDVI range @ 2km [-]

0.02

NDVI range @ 5km [-]

0.03

NDVI range @ 10km [-]

0.04

NDVI range @ 20km [-]

0.05


NDVI slope @ 1 km

5.92111957805e-05

NDVI slope @ 2 km

6.94234271546e-05

NDVI slope @ 5 km

5.24555546312e-05

NDVI slope @ 10 km

2.22708606614e-05

NDVI slope @ 20 km

8.71343407632e-06


Temporal stability analysis

+000 deg (BHR)


BHR statistics

Temporal stability [1/decade]:


abs

rel


Weighted least square:

None


Ordinary least square:

None


Probabilities that GCOS criteria is met:

Weighted least square:

None %

Ordinary least square:

None %


DHR statistics

Temporal stability [1/decade]:


abs

rel


Weighted least square:

None


Ordinary least square:

None


Probabilities that GCOS criteria is met:

Weighted least square:

None %

Ordinary least square:

None %


+057/+063 deg (BHR)


BHR statistics

Temporal stability [1/decade]:


abs

rel


Weighted least square:

None


Ordinary least square:

None


Probabilities that GCOS criteria is met:

Weighted least square:

None %

Ordinary least square:

None %


DHR statistics

Temporal stability [1/decade]:


abs

rel


Weighted least square:

None


Ordinary least square:

None


Probabilities that GCOS criteria is met:

Weighted least square:

None %

Ordinary least square:

None %


Temporal anomaly analyis

The variance of the temporal anomalies provides an additional measure about the stability of the signal AFTER removal of the mean seasonal cylce.

+000 deg


+057/+063 deg