US-FMF


Location

lon / lat [deg]: -111.7273 / 35.1426

Source network: FLUXNET


Geostationary surface albedo (GSA) data


“+000”


“+057/+063”


Landcover information (based on ESA CCI landcover data)


Landcover fractions @ 2km distance


Landcover fractions @ 20 km distance


Legend


Distance to open water bodies [km]:

4.09

Distance to urban areas [km]:

3.13


Radius: 1 km

Number of landcover classes:

1

Dominant landcover type:

70: Tree cover, needleleaved, evergreen, closed to open (>15%)

Fraction of dominant landcover type [%]:

100.0


Radius: 2 km

Number of landcover classes:

1

Dominant landcover type:

70: Tree cover, needleleaved, evergreen, closed to open (>15%)

Fraction of dominant landcover type [%]:

100.0


Radius: 5 km

Number of landcover classes:

4

Dominant landcover type:

70: Tree cover, needleleaved, evergreen, closed to open (>15%)

Fraction of dominant landcover type [%]:

95.0


Radius: 10 km

Number of landcover classes:

3

Dominant landcover type:

70: Tree cover, needleleaved, evergreen, closed to open (>15%)

Fraction of dominant landcover type [%]:

89.0


Radius: 20 km

Number of landcover classes:

4

Dominant landcover type:

70: Tree cover, needleleaved, evergreen, closed to open (>15%)

Fraction of dominant landcover type [%]:

92.0


Disturbances


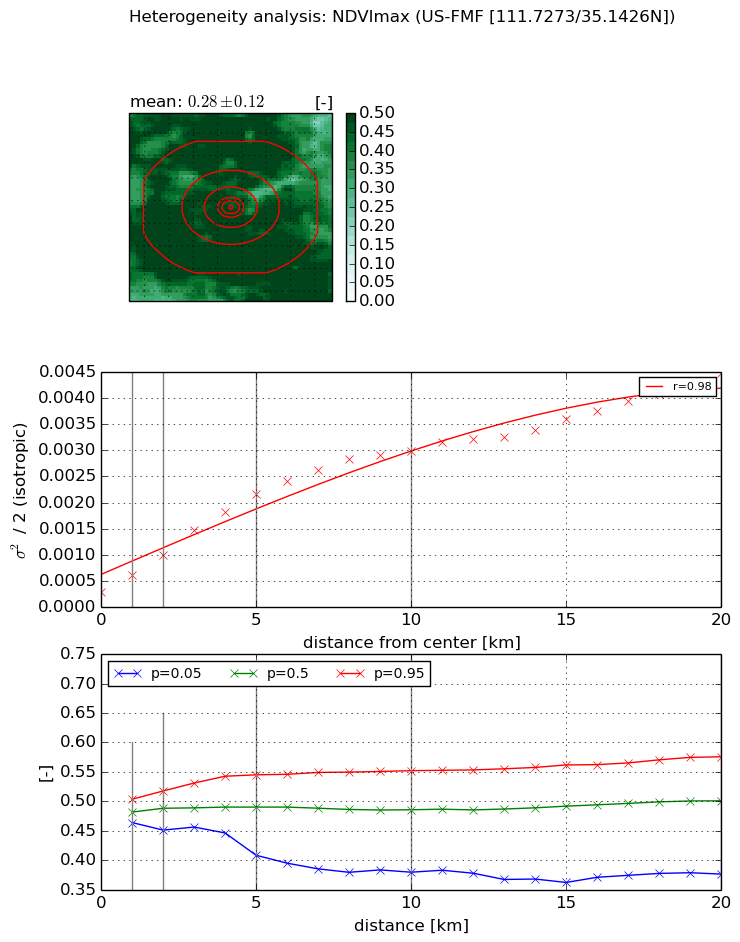
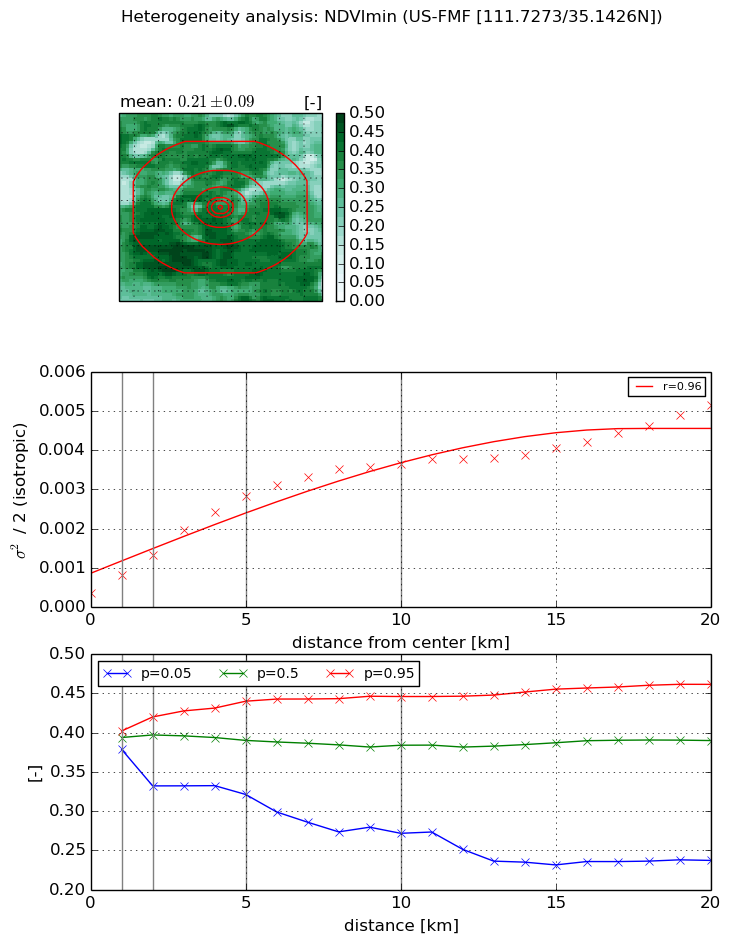
Heterogeneity analysis

The heterogeneity analysis provides information about the spatial and temporal heterogeneity of the site.

Topography


Roman et al. (2009) index


St

2.62754066931

Rcv

0.141751736906

Rse

0.0

Rst

-3.33784504313e-07

Rsv

-0.999999999997


Height range @ 1km [m]

32

Height range @ 2km [m]

146

Height range @ 5km [m]

217

Height range @ 10km [m]

-999

Height range @ 20km [m]

-999


Variance slope @ 1 km

739

Variance slope @ 2 km

812

Variance slope @ 5 km

937

Variance slope @ 10 km

-999

Variance slope @ 20 km

-999


NDVI (max. NDVI composite)


Roman et al. (2009) index


St

3.16637100241

Rcv

0.569640873165

Rse

0.0

Rst

-1.730796815e-08

Rsv

-0.377815992411


NDVI range @ 1km [-]

0.04

NDVI range @ 2km [-]

0.07

NDVI range @ 5km [-]

0.14

NDVI range @ 10km [-]

0.17

NDVI range @ 20km [-]

0.2


Variance slope @ 1 km

0.000328744791489

Variance slope @ 2 km

0.000360905304081

Variance slope @ 5 km

0.000384661103088

Variance slope @ 10 km

0.000282559805515

Variance slope @ 20 km

0.00018467603111


NDVI (min. NDVI composite)I


Roman et al. (2009) index


St

2.09071695584e-07

Rcv

0.33880303731

Rse

0.0

Rst

0.15390720296

Rsv

14349144.147


NDVI range @ 1km [-]

0.02

NDVI range @ 2km [-]

0.09

NDVI range @ 5km [-]

0.12

NDVI range @ 10km [-]

0.17

NDVI range @ 20km [-]

0.22


NDVI slope @ 1 km

0.000434780798342

NDVI slope @ 2 km

0.000478850755276

NDVI slope @ 5 km

0.000508158107602

NDVI slope @ 10 km

0.000340183090688

NDVI slope @ 20 km

0.000195284421077


Temporal stability analysis

+000 deg (BHR)


BHR statistics

Temporal stability [1/decade]:


abs

rel


Weighted least square:

None


Ordinary least square:

None


Probabilities that GCOS criteria is met:

Weighted least square:

None %

Ordinary least square:

None %


DHR statistics

Temporal stability [1/decade]:


abs

rel


Weighted least square:

None


Ordinary least square:

None


Probabilities that GCOS criteria is met:

Weighted least square:

None %

Ordinary least square:

None %


+057/+063 deg (BHR)


BHR statistics

Temporal stability [1/decade]:


abs

rel


Weighted least square:

None


Ordinary least square:

None


Probabilities that GCOS criteria is met:

Weighted least square:

None %

Ordinary least square:

None %


DHR statistics

Temporal stability [1/decade]:


abs

rel


Weighted least square:

None


Ordinary least square:

None


Probabilities that GCOS criteria is met:

Weighted least square:

None %

Ordinary least square:

None %


Temporal anomaly analyis

The variance of the temporal anomalies provides an additional measure about the stability of the signal AFTER removal of the mean seasonal cylce.

+000 deg


+057/+063 deg