US-FPE


Location

lon / lat [deg]: -105.1019 / 48.3077

Source network: FLUXNET


Geostationary surface albedo (GSA) data


“+000”


“+057/+063”


Landcover information (based on ESA CCI landcover data)


Landcover fractions @ 2km distance


Landcover fractions @ 20 km distance


Legend


Distance to open water bodies [km]:

9.74

Distance to urban areas [km]:

22.5


Radius: 1 km

Number of landcover classes:

1

Dominant landcover type:

130: grassland

Fraction of dominant landcover type [%]:

100.0


Radius: 2 km

Number of landcover classes:

1

Dominant landcover type:

130: grassland

Fraction of dominant landcover type [%]:

99.0


Radius: 5 km

Number of landcover classes:

2

Dominant landcover type:

130: grassland

Fraction of dominant landcover type [%]:

81.0


Radius: 10 km

Number of landcover classes:

2

Dominant landcover type:

130: grassland

Fraction of dominant landcover type [%]:

65.0


Radius: 20 km

Number of landcover classes:

2

Dominant landcover type:

130: grassland

Fraction of dominant landcover type [%]:

66.0


Disturbances


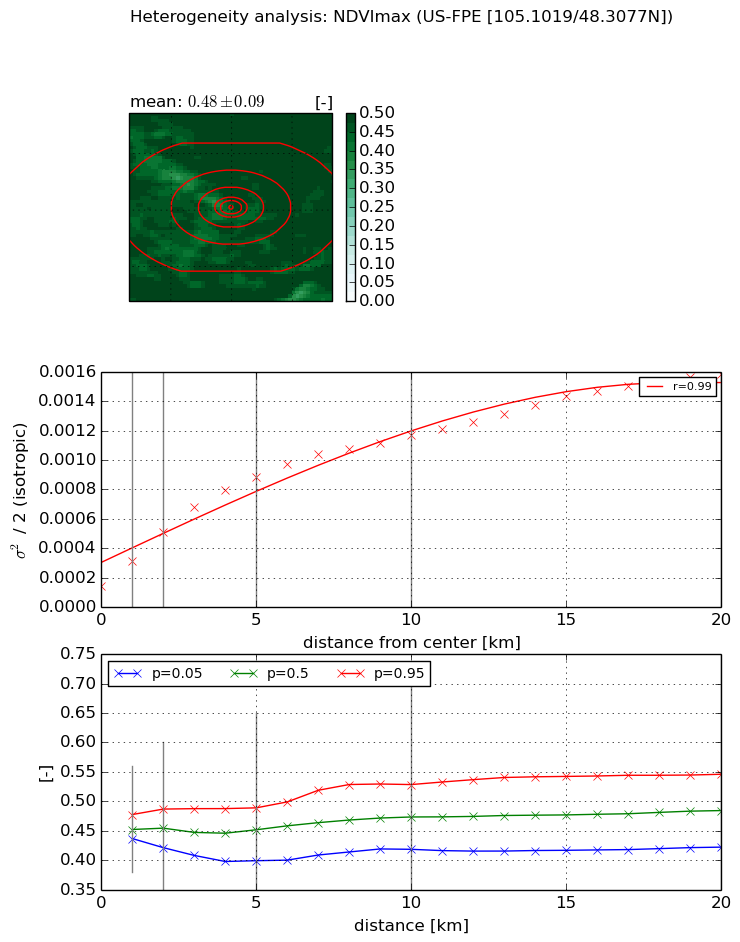
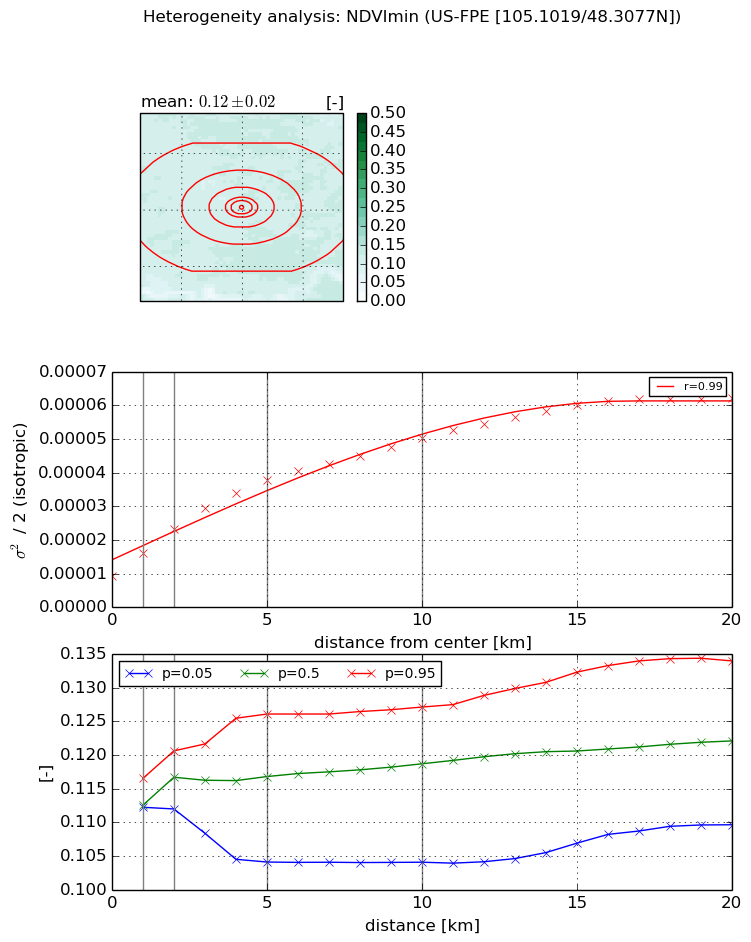
Heterogeneity analysis

The heterogeneity analysis provides information about the spatial and temporal heterogeneity of the site.

Topography


Roman et al. (2009) index


St

4.04784366598

Rcv

0.441451649097

Rse

0.0

Rst

-0.0399258449596

Rsv

0.259757848004


Height range @ 1km [m]

26

Height range @ 2km [m]

44

Height range @ 5km [m]

111

Height range @ 10km [m]

-999

Height range @ 20km [m]

-999


Variance slope @ 1 km

165

Variance slope @ 2 km

224

Variance slope @ 5 km

335

Variance slope @ 10 km

-999

Variance slope @ 20 km

-999


NDVI (max. NDVI composite)


Roman et al. (2009) index


St

10.6992964553

Rcv

0.0223805210227

Rse

0.0

Rst

-0.0191146259029

Rsv

-0.238897121157


NDVI range @ 1km [-]

0.04

NDVI range @ 2km [-]

0.07

NDVI range @ 5km [-]

0.09

NDVI range @ 10km [-]

0.11

NDVI range @ 20km [-]

0.12


Variance slope @ 1 km

0.000169585878156

Variance slope @ 2 km

0.000183583289253

Variance slope @ 5 km

0.000153226355772

Variance slope @ 10 km

9.96279054214e-05

Variance slope @ 20 km

6.41420512742e-05


NDVI (min. NDVI composite)I


Roman et al. (2009) index


St

2.79116078235

Rcv

0.396561684637

Rse

0.0

Rst

-0.0278381695018

Rsv

0.650421782424


NDVI range @ 1km [-]

0.0

NDVI range @ 2km [-]

0.01

NDVI range @ 5km [-]

0.02

NDVI range @ 10km [-]

0.02

NDVI range @ 20km [-]

0.02


NDVI slope @ 1 km

6.84627987778e-06

NDVI slope @ 2 km

7.06652097631e-06

NDVI slope @ 5 km

5.81736701289e-06

NDVI slope @ 10 km

3.89789313188e-06

NDVI slope @ 20 km

2.45764995627e-06


Temporal stability analysis

+000 deg (BHR)


BHR statistics

Temporal stability [1/decade]:


abs

rel


Weighted least square:

None


Ordinary least square:

None


Probabilities that GCOS criteria is met:

Weighted least square:

None %

Ordinary least square:

None %


DHR statistics

Temporal stability [1/decade]:


abs

rel


Weighted least square:

None


Ordinary least square:

None


Probabilities that GCOS criteria is met:

Weighted least square:

None %

Ordinary least square:

None %


+057/+063 deg (BHR)


BHR statistics

Temporal stability [1/decade]:


abs

rel


Weighted least square:

None


Ordinary least square:

None


Probabilities that GCOS criteria is met:

Weighted least square:

None %

Ordinary least square:

None %


DHR statistics

Temporal stability [1/decade]:


abs

rel


Weighted least square:

None


Ordinary least square:

None


Probabilities that GCOS criteria is met:

Weighted least square:

None %

Ordinary least square:

None %


Temporal anomaly analyis

The variance of the temporal anomalies provides an additional measure about the stability of the signal AFTER removal of the mean seasonal cylce.

+000 deg


+057/+063 deg