US-FUF


Location

lon / lat [deg]: -111.762 / 35.089

Source network: FLUXNET


Geostationary surface albedo (GSA) data


“+000”


“+057/+063”


Landcover information (based on ESA CCI landcover data)


Landcover fractions @ 2km distance


Landcover fractions @ 20 km distance


Legend


Distance to open water bodies [km]:

6.08

Distance to urban areas [km]:

5.53


Radius: 1 km

Number of landcover classes:

1

Dominant landcover type:

70: Tree cover, needleleaved, evergreen, closed to open (>15%)

Fraction of dominant landcover type [%]:

100.0


Radius: 2 km

Number of landcover classes:

1

Dominant landcover type:

70: Tree cover, needleleaved, evergreen, closed to open (>15%)

Fraction of dominant landcover type [%]:

100.0


Radius: 5 km

Number of landcover classes:

2

Dominant landcover type:

70: Tree cover, needleleaved, evergreen, closed to open (>15%)

Fraction of dominant landcover type [%]:

98.0


Radius: 10 km

Number of landcover classes:

3

Dominant landcover type:

70: Tree cover, needleleaved, evergreen, closed to open (>15%)

Fraction of dominant landcover type [%]:

96.0


Radius: 20 km

Number of landcover classes:

3

Dominant landcover type:

70: Tree cover, needleleaved, evergreen, closed to open (>15%)

Fraction of dominant landcover type [%]:

93.0


Disturbances


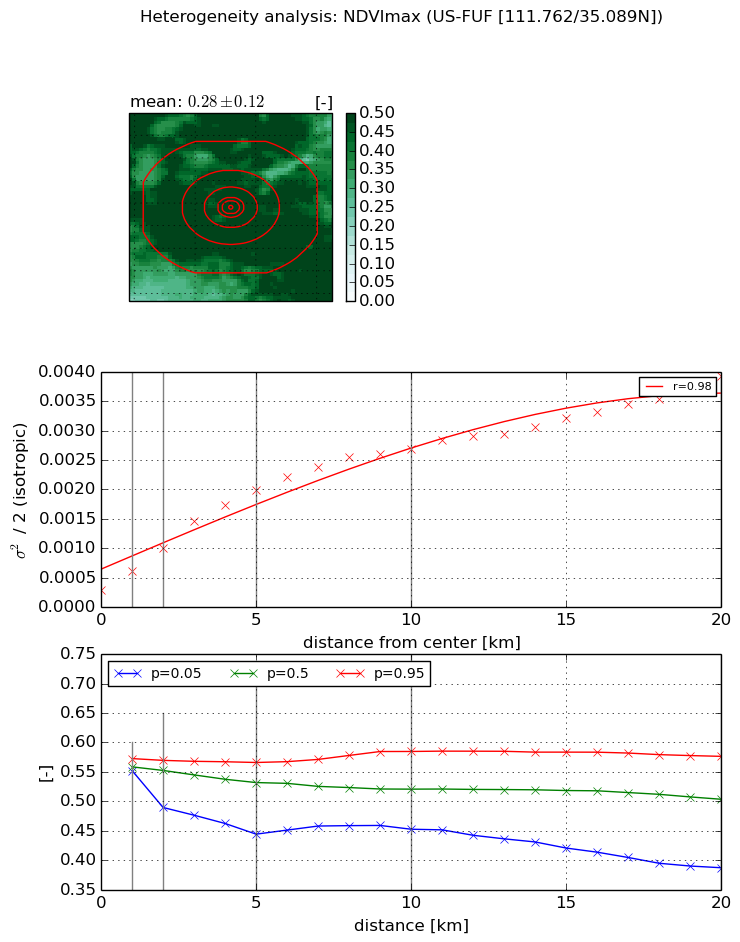
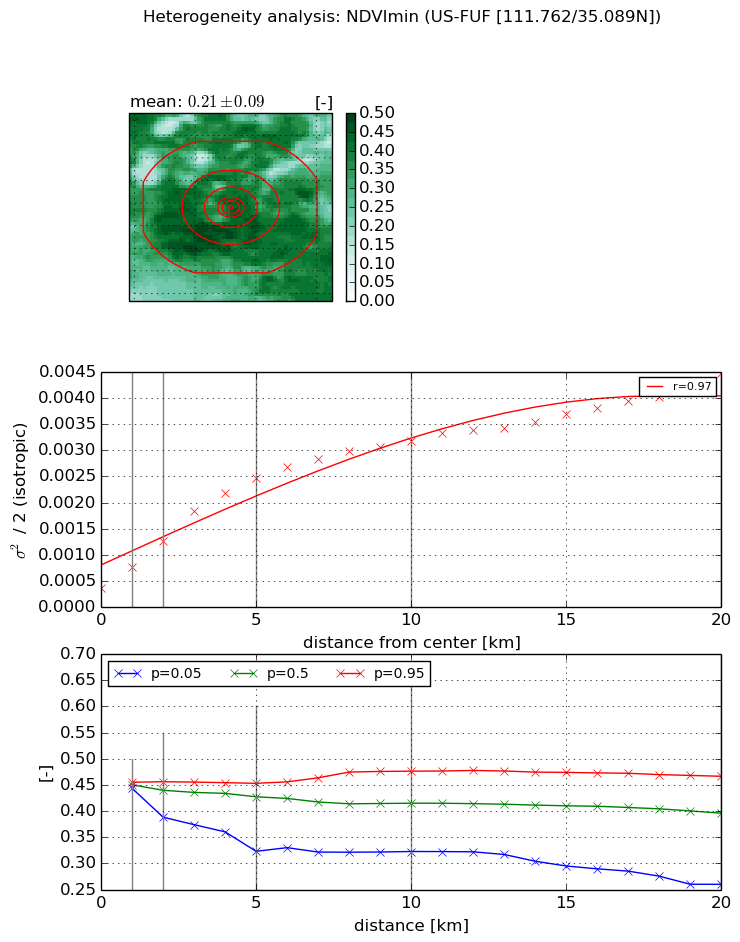
Heterogeneity analysis

The heterogeneity analysis provides information about the spatial and temporal heterogeneity of the site.

Topography


Roman et al. (2009) index


St

2.41027388678

Rcv

0.474727061779

Rse

0.0

Rst

0.0481311690472

Rsv

0.721813595249


Height range @ 1km [m]

68

Height range @ 2km [m]

113

Height range @ 5km [m]

286

Height range @ 10km [m]

-999

Height range @ 20km [m]

-999


Variance slope @ 1 km

1263

Variance slope @ 2 km

1515

Variance slope @ 5 km

1549

Variance slope @ 10 km

-999

Variance slope @ 20 km

-999


NDVI (max. NDVI composite)


Roman et al. (2009) index


St

2.21681662111

Rcv

0.236361201232

Rse

0.0

Rst

0.00624674940269

Rsv

1.11068395968


NDVI range @ 1km [-]

0.02

NDVI range @ 2km [-]

0.08

NDVI range @ 5km [-]

0.12

NDVI range @ 10km [-]

0.13

NDVI range @ 20km [-]

0.19


Variance slope @ 1 km

0.000329950315166

Variance slope @ 2 km

0.000360863363567

Variance slope @ 5 km

0.000354211120893

Variance slope @ 10 km

0.000244882920609

Variance slope @ 20 km

0.000156038785535


NDVI (min. NDVI composite)I


Roman et al. (2009) index


St

1.90759856487e-07

Rcv

0.436806312158

Rse

0.0

Rst

0.134964042489

Rsv

15726578.6743


NDVI range @ 1km [-]

0.01

NDVI range @ 2km [-]

0.07

NDVI range @ 5km [-]

0.13

NDVI range @ 10km [-]

0.15

NDVI range @ 20km [-]

0.21


NDVI slope @ 1 km

0.000415583902639

NDVI slope @ 2 km

0.000453753955132

NDVI slope @ 5 km

0.000440067429513

NDVI slope @ 10 km

0.000280521066381

NDVI slope @ 20 km

0.000170440306913


Temporal stability analysis

+000 deg (BHR)


BHR statistics

Temporal stability [1/decade]:


abs

rel


Weighted least square:

None


Ordinary least square:

None


Probabilities that GCOS criteria is met:

Weighted least square:

None %

Ordinary least square:

None %


DHR statistics

Temporal stability [1/decade]:


abs

rel


Weighted least square:

None


Ordinary least square:

None


Probabilities that GCOS criteria is met:

Weighted least square:

None %

Ordinary least square:

None %


+057/+063 deg (BHR)


BHR statistics

Temporal stability [1/decade]:


abs

rel


Weighted least square:

None


Ordinary least square:

None


Probabilities that GCOS criteria is met:

Weighted least square:

None %

Ordinary least square:

None %


DHR statistics

Temporal stability [1/decade]:


abs

rel


Weighted least square:

None


Ordinary least square:

None


Probabilities that GCOS criteria is met:

Weighted least square:

None %

Ordinary least square:

None %


Temporal anomaly analyis

The variance of the temporal anomalies provides an additional measure about the stability of the signal AFTER removal of the mean seasonal cylce.

+000 deg


+057/+063 deg