US-HA1


Location

lon / lat [deg]: -72.1715 / 42.5378

Source network: FLUXNET


Geostationary surface albedo (GSA) data


“+000”


“+057/+063”


Landcover information (based on ESA CCI landcover data)


Landcover fractions @ 2km distance


Landcover fractions @ 20 km distance


Legend


Distance to open water bodies [km]:

2.29

Distance to urban areas [km]:

1.8


Radius: 1 km

Number of landcover classes:

4

Dominant landcover type:

61: Tree cover, broadleaved, decidous (closed > 40%)

Fraction of dominant landcover type [%]:

71.0


Radius: 2 km

Number of landcover classes:

4

Dominant landcover type:

61: Tree cover, broadleaved, decidous (closed > 40%)

Fraction of dominant landcover type [%]:

70.0


Radius: 5 km

Number of landcover classes:

7

Dominant landcover type:

61: Tree cover, broadleaved, decidous (closed > 40%)

Fraction of dominant landcover type [%]:

58.0


Radius: 10 km

Number of landcover classes:

7

Dominant landcover type:

61: Tree cover, broadleaved, decidous (closed > 40%)

Fraction of dominant landcover type [%]:

44.0


Radius: 20 km

Number of landcover classes:

7

Dominant landcover type:

61: Tree cover, broadleaved, decidous (closed > 40%)

Fraction of dominant landcover type [%]:

28.0


Disturbances


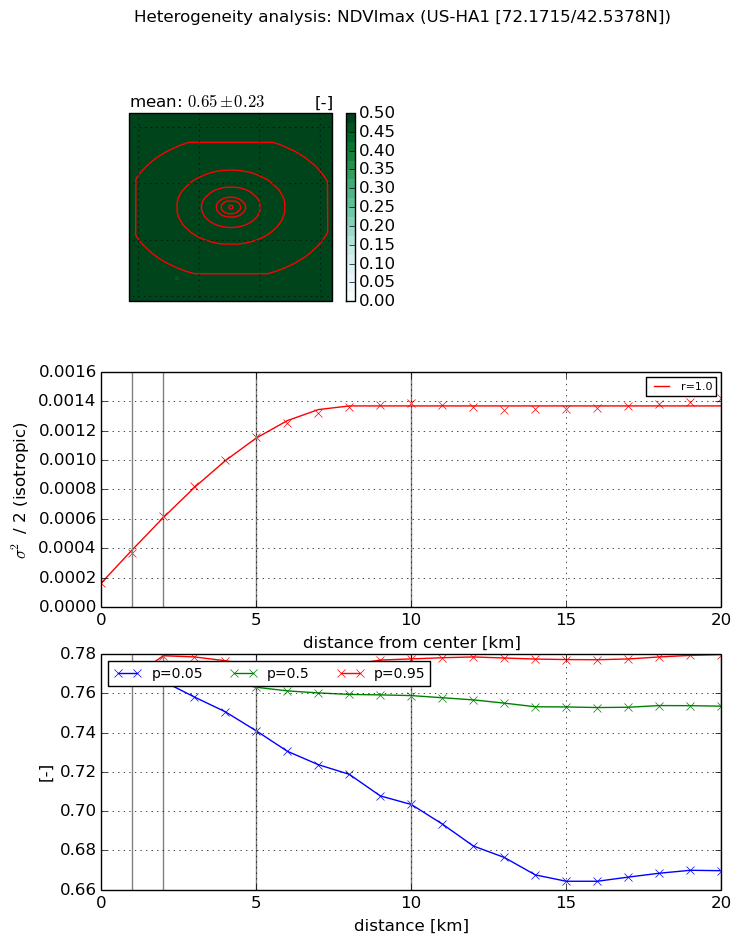
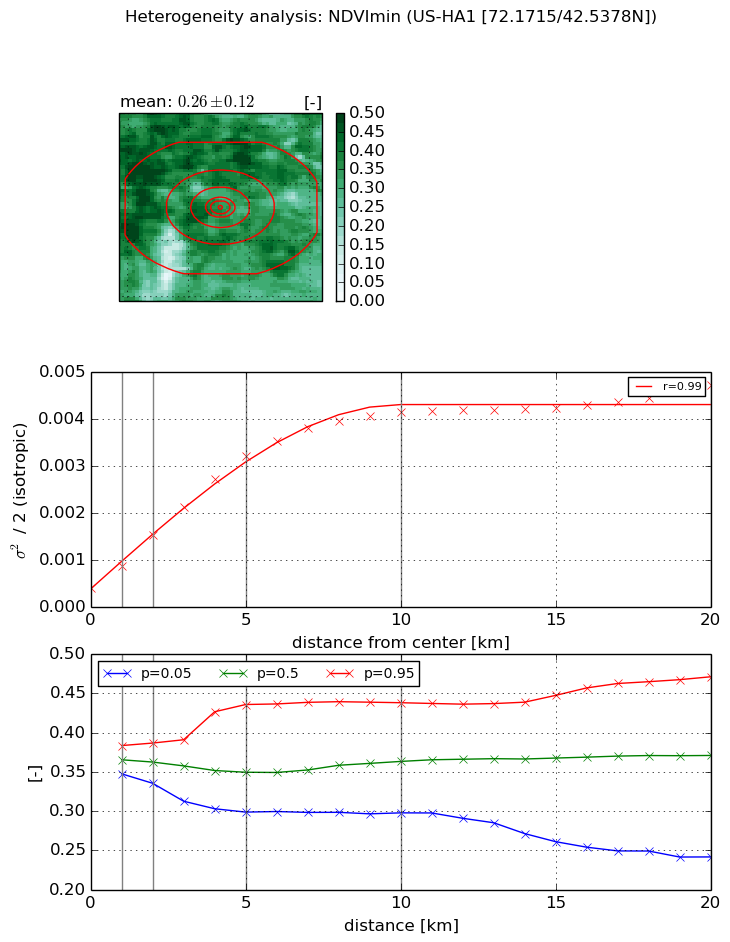
Heterogeneity analysis

The heterogeneity analysis provides information about the spatial and temporal heterogeneity of the site.

Topography


Roman et al. (2009) index


St

4.51097516635

Rcv

0.241075673503

Rse

0.0

Rst

-0.00495409151099

Rsv

0.419014907007


Height range @ 1km [m]

67

Height range @ 2km [m]

102

Height range @ 5km [m]

132

Height range @ 10km [m]

-999

Height range @ 20km [m]

-999


Variance slope @ 1 km

488

Variance slope @ 2 km

497

Variance slope @ 5 km

386

Variance slope @ 10 km

-999

Variance slope @ 20 km

-999


NDVI (max. NDVI composite)


Roman et al. (2009) index


St

1.14873384885

Rcv

0.937852517927

Rse

0.0

Rst

-0.673720265269

Rsv

-0.999998211263


NDVI range @ 1km [-]

0.0

NDVI range @ 2km [-]

0.01

NDVI range @ 5km [-]

0.03

NDVI range @ 10km [-]

0.07

NDVI range @ 20km [-]

0.11


Variance slope @ 1 km

0.000200730340022

Variance slope @ 2 km

0.000226434575787

Variance slope @ 5 km

0.000201444940173

Variance slope @ 10 km

0.000123398368538

Variance slope @ 20 km

4.5630447188e-05


NDVI (min. NDVI composite)I


Roman et al. (2009) index


St

1.5558225183

Rcv

0.621568505911

Rse

0.0

Rst

-2.77626075065e-09

Rsv

1.30667199735


NDVI range @ 1km [-]

0.04

NDVI range @ 2km [-]

0.05

NDVI range @ 5km [-]

0.14

NDVI range @ 10km [-]

0.14

NDVI range @ 20km [-]

0.23


NDVI slope @ 1 km

0.000461046282879

NDVI slope @ 2 km

0.0005581132236

NDVI slope @ 5 km

0.000575577945859

NDVI slope @ 10 km

0.000390019541492

NDVI slope @ 20 km

0.00017487092947


Temporal stability analysis

+000 deg (BHR)


BHR statistics

Temporal stability [1/decade]:


abs

rel


Weighted least square:

-99999.0


Ordinary least square:

-99999.0


Probabilities that GCOS criteria is met:

Weighted least square:

-99999.0 %

Ordinary least square:

-99999.0 %


DHR statistics

Temporal stability [1/decade]:


abs

rel


Weighted least square:

-99999.0


Ordinary least square:

-99999.0


Probabilities that GCOS criteria is met:

Weighted least square:

-99999.0 %

Ordinary least square:

-99999.0 %


+057/+063 deg (BHR)


BHR statistics

Temporal stability [1/decade]:


abs

rel


Weighted least square:

None


Ordinary least square:

None


Probabilities that GCOS criteria is met:

Weighted least square:

None %

Ordinary least square:

None %


DHR statistics

Temporal stability [1/decade]:


abs

rel


Weighted least square:

None


Ordinary least square:

None


Probabilities that GCOS criteria is met:

Weighted least square:

None %

Ordinary least square:

None %


Temporal anomaly analyis

The variance of the temporal anomalies provides an additional measure about the stability of the signal AFTER removal of the mean seasonal cylce.

+000 deg


+057/+063 deg