US-MOZ


Location

lon / lat [deg]: -92.2 / 38.7441

Source network: FLUXNET


Geostationary surface albedo (GSA) data


“+000”


“+057/+063”


Landcover information (based on ESA CCI landcover data)


Landcover fractions @ 2km distance


Landcover fractions @ 20 km distance


Legend


Distance to open water bodies [km]:

0.23

Distance to urban areas [km]:

5.14


Radius: 1 km

Number of landcover classes:

3

Dominant landcover type:

61: Tree cover, broadleaved, decidous (closed > 40%)

Fraction of dominant landcover type [%]:

95.0


Radius: 2 km

Number of landcover classes:

5

Dominant landcover type:

61: Tree cover, broadleaved, decidous (closed > 40%)

Fraction of dominant landcover type [%]:

67.0


Radius: 5 km

Number of landcover classes:

4

Dominant landcover type:

130: grassland

Fraction of dominant landcover type [%]:

61.0


Radius: 10 km

Number of landcover classes:

5

Dominant landcover type:

130: grassland

Fraction of dominant landcover type [%]:

74.0


Radius: 20 km

Number of landcover classes:

7

Dominant landcover type:

130: grassland

Fraction of dominant landcover type [%]:

70.0


Disturbances


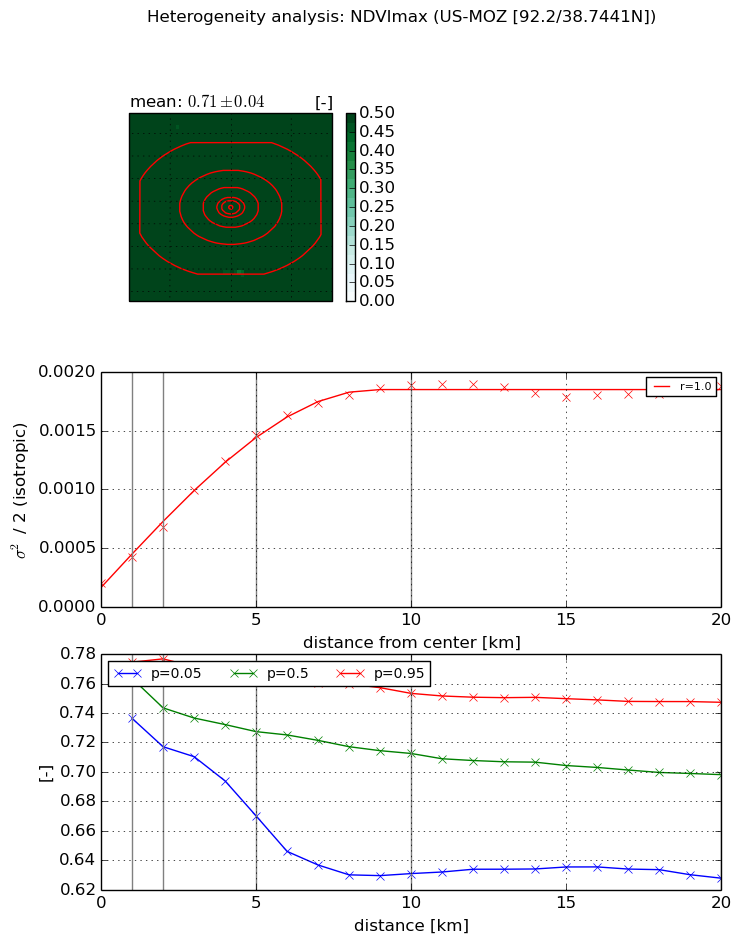
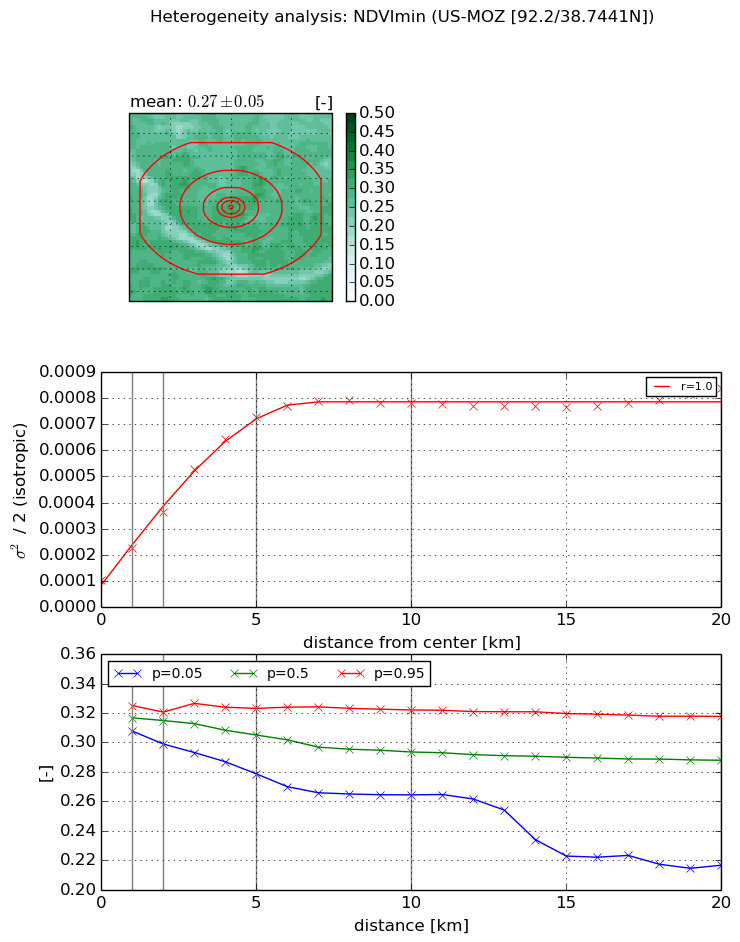
Heterogeneity analysis

The heterogeneity analysis provides information about the spatial and temporal heterogeneity of the site.

Topography


Roman et al. (2009) index


St

9.48488844369

Rcv

-0.0447745019024

Rse

0.0

Rst

-0.00170985226919

Rsv

0.269808243028


Height range @ 1km [m]

51

Height range @ 2km [m]

72

Height range @ 5km [m]

80

Height range @ 10km [m]

-999

Height range @ 20km [m]

-999


Variance slope @ 1 km

213

Variance slope @ 2 km

186

Variance slope @ 5 km

138

Variance slope @ 10 km

-999

Variance slope @ 20 km

-999


NDVI (max. NDVI composite)


Roman et al. (2009) index


St

1.53225802268

Rcv

0.487242032852

Rse

0.0

Rst

-0.228730101335

Rsv

1.24192265611


NDVI range @ 1km [-]

0.04

NDVI range @ 2km [-]

0.06

NDVI range @ 5km [-]

0.09

NDVI range @ 10km [-]

0.12

NDVI range @ 20km [-]

0.12


Variance slope @ 1 km

0.00022242910682

Variance slope @ 2 km

0.00023573308113

Variance slope @ 5 km

0.000258727838579

Variance slope @ 10 km

0.000176514162737

Variance slope @ 20 km

6.59316708555e-05


NDVI (min. NDVI composite)I


Roman et al. (2009) index


St

nan

Rcv

nan

Rse

nan

Rst

nan

Rsv

nan


NDVI range @ 1km [-]

0.02

NDVI range @ 2km [-]

0.02

NDVI range @ 5km [-]

0.04

NDVI range @ 10km [-]

0.06

NDVI range @ 20km [-]

0.1


NDVI slope @ 1 km

0.000123981916135

NDVI slope @ 2 km

0.00013030539921

NDVI slope @ 5 km

0.000129751403633

NDVI slope @ 10 km

6.85681387338e-05

NDVI slope @ 20 km

2.42474459856e-05


Temporal stability analysis

+000 deg (BHR)


BHR statistics

Temporal stability [1/decade]:


abs

rel


Weighted least square:

None


Ordinary least square:

None


Probabilities that GCOS criteria is met:

Weighted least square:

None %

Ordinary least square:

None %


DHR statistics

Temporal stability [1/decade]:


abs

rel


Weighted least square:

None


Ordinary least square:

None


Probabilities that GCOS criteria is met:

Weighted least square:

None %

Ordinary least square:

None %


+057/+063 deg (BHR)


BHR statistics

Temporal stability [1/decade]:


abs

rel


Weighted least square:

None


Ordinary least square:

None


Probabilities that GCOS criteria is met:

Weighted least square:

None %

Ordinary least square:

None %


DHR statistics

Temporal stability [1/decade]:


abs

rel


Weighted least square:

None


Ordinary least square:

None


Probabilities that GCOS criteria is met:

Weighted least square:

None %

Ordinary least square:

None %


Temporal anomaly analyis

The variance of the temporal anomalies provides an additional measure about the stability of the signal AFTER removal of the mean seasonal cylce.

+000 deg


+057/+063 deg