US-NC1


Location

lon / lat [deg]: -76.7115 / 35.8115

Source network: FLUXNET


Geostationary surface albedo (GSA) data


“+000”


“+057/+063”


Landcover information (based on ESA CCI landcover data)


Landcover fractions @ 2km distance


Landcover fractions @ 20 km distance


Legend


Distance to open water bodies [km]:

7.26

Distance to urban areas [km]:

4.76


Radius: 1 km

Number of landcover classes:

3

Dominant landcover type:

160: Tree cover, flooded, fresh or brakish water

Fraction of dominant landcover type [%]:

45.0


Radius: 2 km

Number of landcover classes:

7

Dominant landcover type:

70: Tree cover, needleleaved, evergreen, closed to open (>15%)

Fraction of dominant landcover type [%]:

35.0


Radius: 5 km

Number of landcover classes:

8

Dominant landcover type:

10: cropland, rainfed

Fraction of dominant landcover type [%]:

41.0


Radius: 10 km

Number of landcover classes:

9

Dominant landcover type:

10: cropland, rainfed

Fraction of dominant landcover type [%]:

46.0


Radius: 20 km

Number of landcover classes:

7

Dominant landcover type:

10: cropland, rainfed

Fraction of dominant landcover type [%]:

46.0


Disturbances


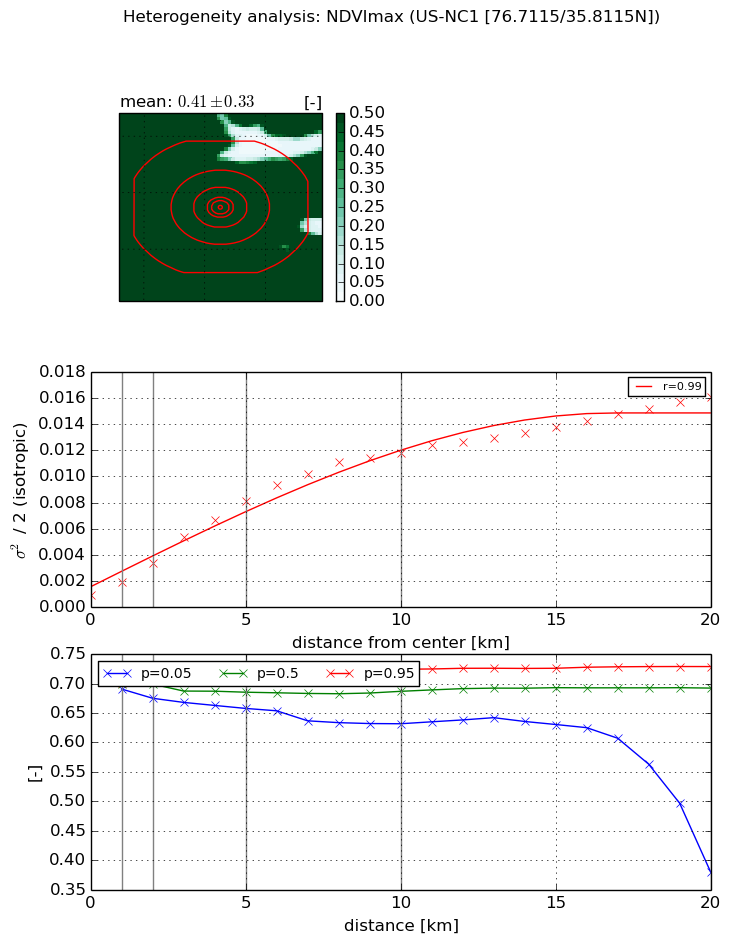
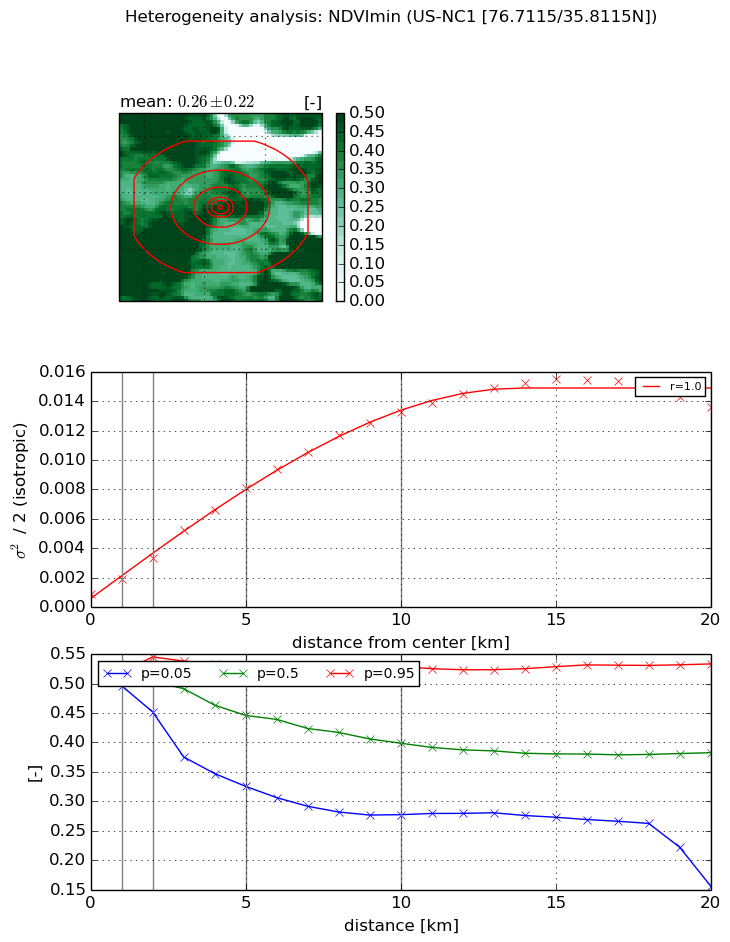
Heterogeneity analysis

The heterogeneity analysis provides information about the spatial and temporal heterogeneity of the site.

Topography


Roman et al. (2009) index


St

1.77129413415

Rcv

0.187723190995

Rse

0.0

Rst

-0.108531204212

Rsv

1.39742252844


Height range @ 1km [m]

12

Height range @ 2km [m]

13

Height range @ 5km [m]

14

Height range @ 10km [m]

-999

Height range @ 20km [m]

-999


Variance slope @ 1 km

10

Variance slope @ 2 km

6

Variance slope @ 5 km

4

Variance slope @ 10 km

-999

Variance slope @ 20 km

-999


NDVI (max. NDVI composite)


Roman et al. (2009) index


St

2.58170555926

Rcv

0.351746427037

Rse

0.0

Rst

-0.140986257002

Rsv

0.669289836013


NDVI range @ 1km [-]

0.01

NDVI range @ 2km [-]

0.03

NDVI range @ 5km [-]

0.06

NDVI range @ 10km [-]

0.09

NDVI range @ 20km [-]

0.35


Variance slope @ 1 km

0.00103314093295

Variance slope @ 2 km

0.0012369716893

Variance slope @ 5 km

0.0014920825943

Variance slope @ 10 km

0.00116328327534

Variance slope @ 20 km

0.000697567089214


NDVI (min. NDVI composite)I


Roman et al. (2009) index


St

8.69972969671

Rcv

0.25066689427

Rse

0.0

Rst

0.00423804183211

Rsv

0.0899333640041


NDVI range @ 1km [-]

0.02

NDVI range @ 2km [-]

0.09

NDVI range @ 5km [-]

0.2

NDVI range @ 10km [-]

0.25

NDVI range @ 20km [-]

0.38


NDVI slope @ 1 km

0.00103553509323

NDVI slope @ 2 km

0.00121190876884

NDVI slope @ 5 km

0.00148671175561

NDVI slope @ 10 km

0.00130205565423

NDVI slope @ 20 km

0.000695114116887


Temporal stability analysis

+000 deg (BHR)


BHR statistics

Temporal stability [1/decade]:


abs

rel


Weighted least square:

-99999.0


Ordinary least square:

-99999.0


Probabilities that GCOS criteria is met:

Weighted least square:

-99999.0 %

Ordinary least square:

-99999.0 %


DHR statistics

Temporal stability [1/decade]:


abs

rel


Weighted least square:

-99999.0


Ordinary least square:

-99999.0


Probabilities that GCOS criteria is met:

Weighted least square:

-99999.0 %

Ordinary least square:

-99999.0 %


+057/+063 deg (BHR)


BHR statistics

Temporal stability [1/decade]:


abs

rel


Weighted least square:

None


Ordinary least square:

None


Probabilities that GCOS criteria is met:

Weighted least square:

None %

Ordinary least square:

None %


DHR statistics

Temporal stability [1/decade]:


abs

rel


Weighted least square:

None


Ordinary least square:

None


Probabilities that GCOS criteria is met:

Weighted least square:

None %

Ordinary least square:

None %


Temporal anomaly analyis

The variance of the temporal anomalies provides an additional measure about the stability of the signal AFTER removal of the mean seasonal cylce.

+000 deg


+057/+063 deg