US-NC2


Location

lon / lat [deg]: -76.6679 / 35.8031

Source network: FLUXNET


Geostationary surface albedo (GSA) data


“+000”


“+057/+063”


Landcover information (based on ESA CCI landcover data)


Landcover fractions @ 2km distance


Landcover fractions @ 20 km distance


Legend


Distance to open water bodies [km]:

5.74

Distance to urban areas [km]:

8.08


Radius: 1 km

Number of landcover classes:

4

Dominant landcover type:

160: Tree cover, flooded, fresh or brakish water

Fraction of dominant landcover type [%]:

67.0


Radius: 2 km

Number of landcover classes:

6

Dominant landcover type:

160: Tree cover, flooded, fresh or brakish water

Fraction of dominant landcover type [%]:

58.0


Radius: 5 km

Number of landcover classes:

7

Dominant landcover type:

10: cropland, rainfed

Fraction of dominant landcover type [%]:

40.0


Radius: 10 km

Number of landcover classes:

7

Dominant landcover type:

10: cropland, rainfed

Fraction of dominant landcover type [%]:

63.0


Radius: 20 km

Number of landcover classes:

6

Dominant landcover type:

10: cropland, rainfed

Fraction of dominant landcover type [%]:

46.0


Disturbances


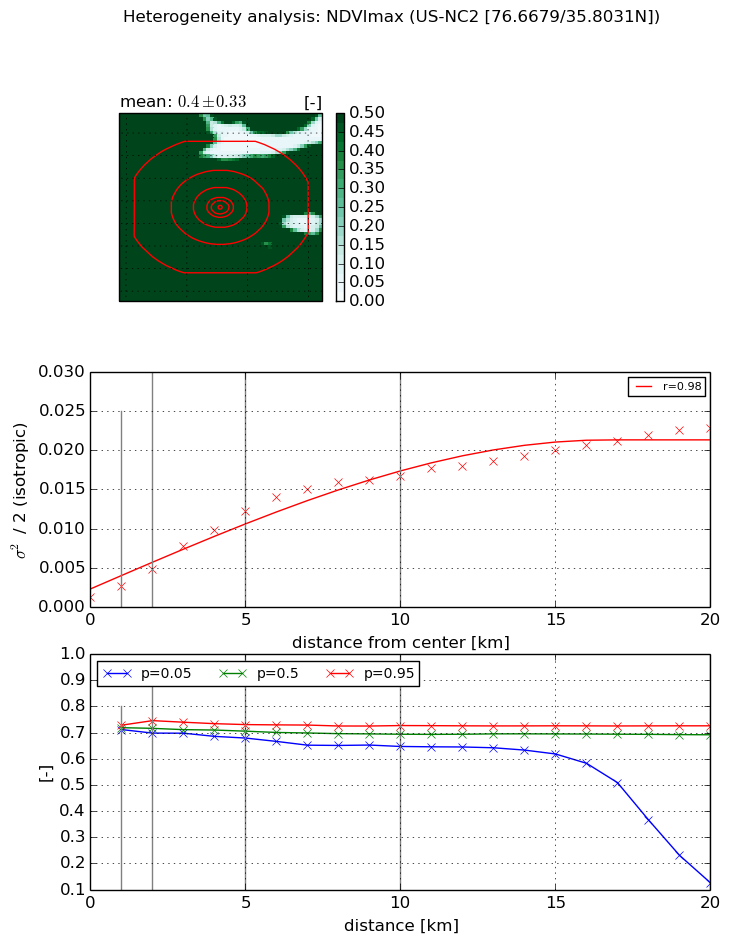
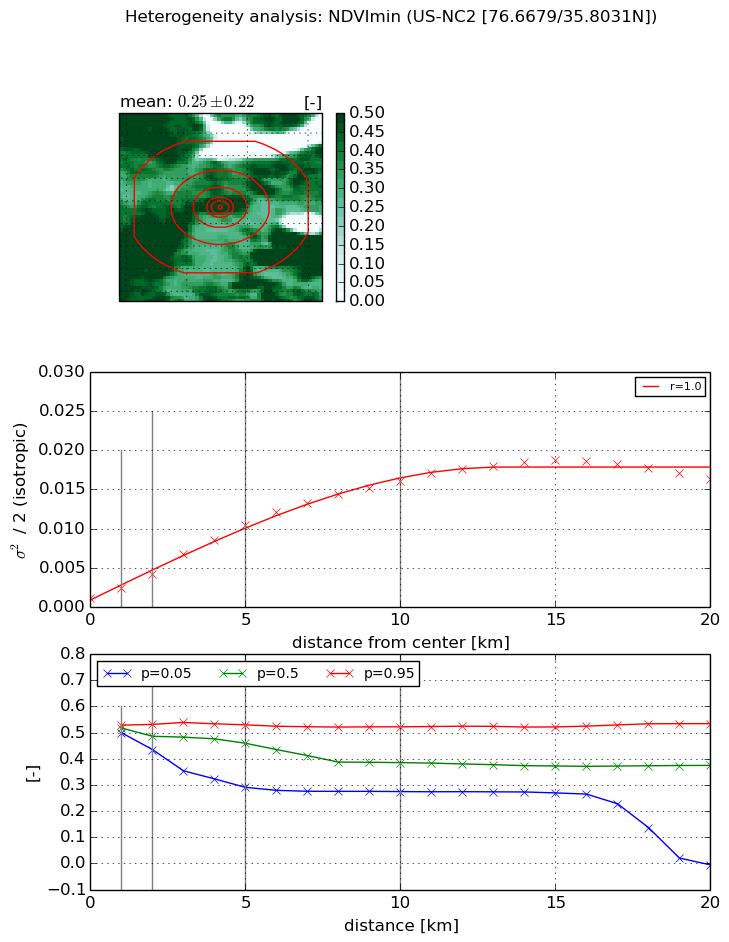
Heterogeneity analysis

The heterogeneity analysis provides information about the spatial and temporal heterogeneity of the site.

Topography


Roman et al. (2009) index


St

2.07384226485

Rcv

0.237212636406

Rse

0.0

Rst

-0.170882208776

Rsv

1.03849540464


Height range @ 1km [m]

11

Height range @ 2km [m]

12

Height range @ 5km [m]

13

Height range @ 10km [m]

-999

Height range @ 20km [m]

-999


Variance slope @ 1 km

10

Variance slope @ 2 km

6

Variance slope @ 5 km

3

Variance slope @ 10 km

-999

Variance slope @ 20 km

-999


NDVI (max. NDVI composite)


Roman et al. (2009) index


St

nan

Rcv

nan

Rse

nan

Rst

nan

Rsv

nan


NDVI range @ 1km [-]

0.02

NDVI range @ 2km [-]

0.05

NDVI range @ 5km [-]

0.05

NDVI range @ 10km [-]

0.08

NDVI range @ 20km [-]

0.6


Variance slope @ 1 km

0.00141127786529

Variance slope @ 2 km

0.00176507269066

Variance slope @ 5 km

0.00226904314279

Variance slope @ 10 km

0.00166663437684

Variance slope @ 20 km

0.000995518945349


NDVI (min. NDVI composite)I


Roman et al. (2009) index


St

6.57984726551e-08

Rcv

0.557875958128

Rse

0.0

Rst

0.142764769634

Rsv

45593762.7857


NDVI range @ 1km [-]

0.03

NDVI range @ 2km [-]

0.1

NDVI range @ 5km [-]

0.24

NDVI range @ 10km [-]

0.25

NDVI range @ 20km [-]

0.54


NDVI slope @ 1 km

0.00128790621772

NDVI slope @ 2 km

0.00154148130992

NDVI slope @ 5 km

0.00192613653491

NDVI slope @ 10 km

0.00156948074928

NDVI slope @ 20 km

0.000806316349997


Temporal stability analysis

+000 deg (BHR)


BHR statistics

Temporal stability [1/decade]:


abs

rel


Weighted least square:

-99999.0


Ordinary least square:

-99999.0


Probabilities that GCOS criteria is met:

Weighted least square:

-99999.0 %

Ordinary least square:

-99999.0 %


DHR statistics

Temporal stability [1/decade]:


abs

rel


Weighted least square:

-99999.0


Ordinary least square:

-99999.0


Probabilities that GCOS criteria is met:

Weighted least square:

-99999.0 %

Ordinary least square:

-99999.0 %


+057/+063 deg (BHR)


BHR statistics

Temporal stability [1/decade]:


abs

rel


Weighted least square:

None


Ordinary least square:

None


Probabilities that GCOS criteria is met:

Weighted least square:

None %

Ordinary least square:

None %


DHR statistics

Temporal stability [1/decade]:


abs

rel


Weighted least square:

None


Ordinary least square:

None


Probabilities that GCOS criteria is met:

Weighted least square:

None %

Ordinary least square:

None %


Temporal anomaly analyis

The variance of the temporal anomalies provides an additional measure about the stability of the signal AFTER removal of the mean seasonal cylce.

+000 deg


+057/+063 deg