US-NE3


Location

lon / lat [deg]: -96.4397 / 41.1797

Source network: FLUXNET


Geostationary surface albedo (GSA) data


“+000”


“+057/+063”


Landcover information (based on ESA CCI landcover data)


Landcover fractions @ 2km distance


Landcover fractions @ 20 km distance


Legend


Distance to open water bodies [km]:

2.31

Distance to urban areas [km]:

13.42


Radius: 1 km

Number of landcover classes:

2

Dominant landcover type:

10: cropland, rainfed

Fraction of dominant landcover type [%]:

56.0


Radius: 2 km

Number of landcover classes:

2

Dominant landcover type:

10: cropland, rainfed

Fraction of dominant landcover type [%]:

66.0


Radius: 5 km

Number of landcover classes:

4

Dominant landcover type:

10: cropland, rainfed

Fraction of dominant landcover type [%]:

73.0


Radius: 10 km

Number of landcover classes:

4

Dominant landcover type:

10: cropland, rainfed

Fraction of dominant landcover type [%]:

76.0


Radius: 20 km

Number of landcover classes:

6

Dominant landcover type:

10: cropland, rainfed

Fraction of dominant landcover type [%]:

76.0


Disturbances


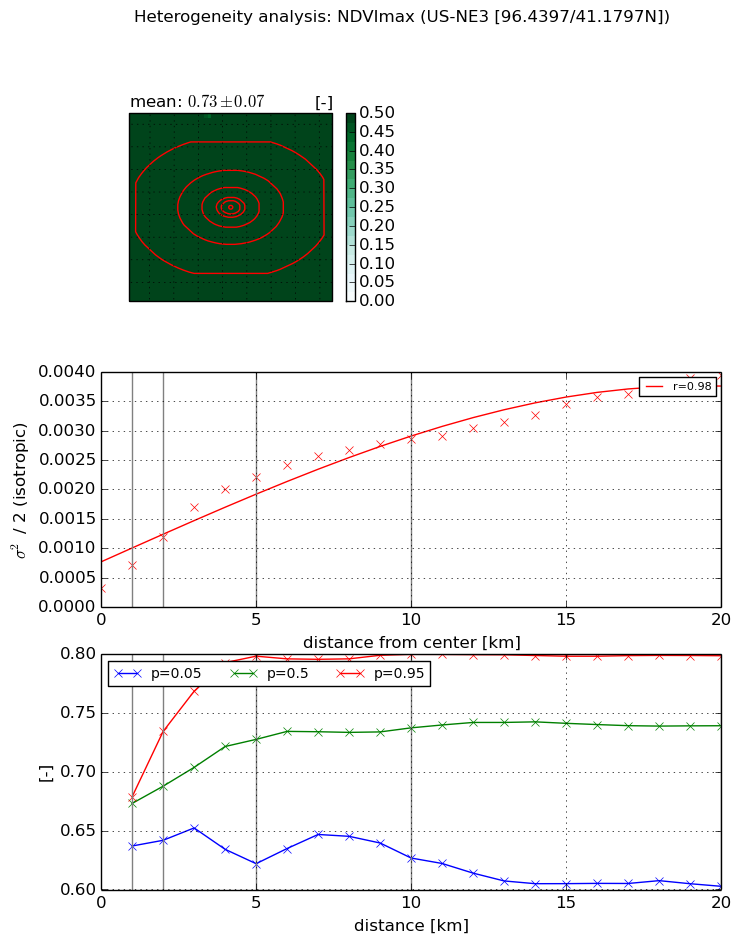
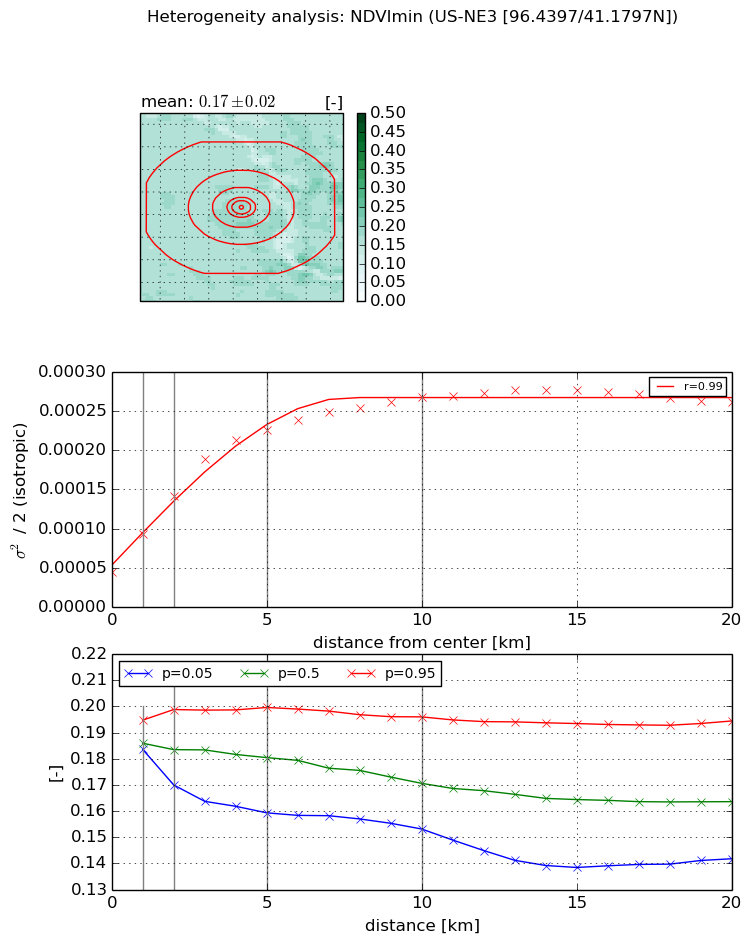
Heterogeneity analysis

The heterogeneity analysis provides information about the spatial and temporal heterogeneity of the site.

Topography


Roman et al. (2009) index


St

0.0149688918388

Rcv

1.10682119379

Rse

0.0

Rst

8.15085274417e-08

Rsv

199.308816188


Height range @ 1km [m]

5

Height range @ 2km [m]

10

Height range @ 5km [m]

29

Height range @ 10km [m]

-999

Height range @ 20km [m]

-999


Variance slope @ 1 km

20

Variance slope @ 2 km

21

Variance slope @ 5 km

18

Variance slope @ 10 km

-999

Variance slope @ 20 km

-999


NDVI (max. NDVI composite)


Roman et al. (2009) index


St

2.01141867849

Rcv

0.36320820574

Rse

0.0

Rst

0.128276639568

Rsv

-0.999999763083


NDVI range @ 1km [-]

0.04

NDVI range @ 2km [-]

0.09

NDVI range @ 5km [-]

0.18

NDVI range @ 10km [-]

0.17

NDVI range @ 20km [-]

0.2


Variance slope @ 1 km

0.000402724339665

Variance slope @ 2 km

0.000436515185925

Variance slope @ 5 km

0.000395547024239

Variance slope @ 10 km

0.000250093990174

Variance slope @ 20 km

0.0001566363614


NDVI (min. NDVI composite)I


Roman et al. (2009) index


St

7.99849258833

Rcv

0.275416196731

Rse

0.0

Rst

6.25766219566e-08

Rsv

0.0996544139311


NDVI range @ 1km [-]

0.01

NDVI range @ 2km [-]

0.03

NDVI range @ 5km [-]

0.04

NDVI range @ 10km [-]

0.04

NDVI range @ 20km [-]

0.05


NDVI slope @ 1 km

4.85898060637e-05

NDVI slope @ 2 km

4.83840045656e-05

NDVI slope @ 5 km

3.75460655069e-05

NDVI slope @ 10 km

2.07284605473e-05

NDVI slope @ 20 km

8.03300798922e-06


Temporal stability analysis

+000 deg (BHR)


BHR statistics

Temporal stability [1/decade]:


abs

rel


Weighted least square:

None


Ordinary least square:

None


Probabilities that GCOS criteria is met:

Weighted least square:

None %

Ordinary least square:

None %


DHR statistics

Temporal stability [1/decade]:


abs

rel


Weighted least square:

None


Ordinary least square:

None


Probabilities that GCOS criteria is met:

Weighted least square:

None %

Ordinary least square:

None %


+057/+063 deg (BHR)


BHR statistics

Temporal stability [1/decade]:


abs

rel


Weighted least square:

None


Ordinary least square:

None


Probabilities that GCOS criteria is met:

Weighted least square:

None %

Ordinary least square:

None %


DHR statistics

Temporal stability [1/decade]:


abs

rel


Weighted least square:

None


Ordinary least square:

None


Probabilities that GCOS criteria is met:

Weighted least square:

None %

Ordinary least square:

None %


Temporal anomaly analyis

The variance of the temporal anomalies provides an additional measure about the stability of the signal AFTER removal of the mean seasonal cylce.

+000 deg


+057/+063 deg