US-NR1


Location

lon / lat [deg]: -105.546 / 40.0329

Source network: FLUXNET


Geostationary surface albedo (GSA) data


“+000”


“+057/+063”


Landcover information (based on ESA CCI landcover data)


Landcover fractions @ 2km distance


Landcover fractions @ 20 km distance


Legend


Distance to open water bodies [km]:

2.86

Distance to urban areas [km]:

3.15


Radius: 1 km

Number of landcover classes:

1

Dominant landcover type:

70: Tree cover, needleleaved, evergreen, closed to open (>15%)

Fraction of dominant landcover type [%]:

100.0


Radius: 2 km

Number of landcover classes:

1

Dominant landcover type:

70: Tree cover, needleleaved, evergreen, closed to open (>15%)

Fraction of dominant landcover type [%]:

100.0


Radius: 5 km

Number of landcover classes:

3

Dominant landcover type:

70: Tree cover, needleleaved, evergreen, closed to open (>15%)

Fraction of dominant landcover type [%]:

86.0


Radius: 10 km

Number of landcover classes:

7

Dominant landcover type:

70: Tree cover, needleleaved, evergreen, closed to open (>15%)

Fraction of dominant landcover type [%]:

76.0


Radius: 20 km

Number of landcover classes:

5

Dominant landcover type:

70: Tree cover, needleleaved, evergreen, closed to open (>15%)

Fraction of dominant landcover type [%]:

82.0


Disturbances


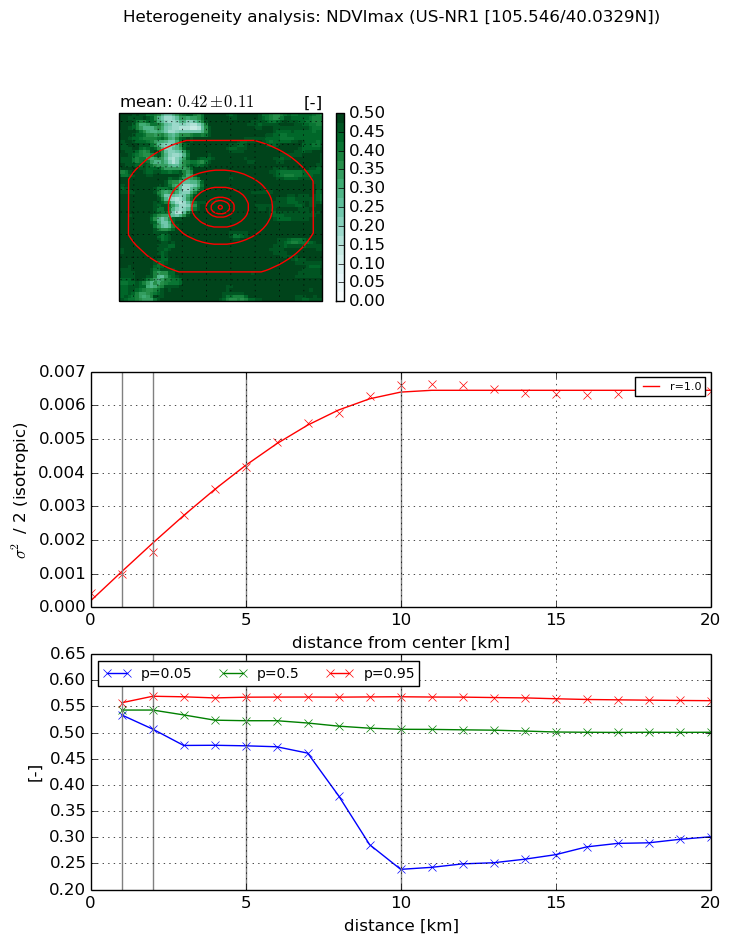
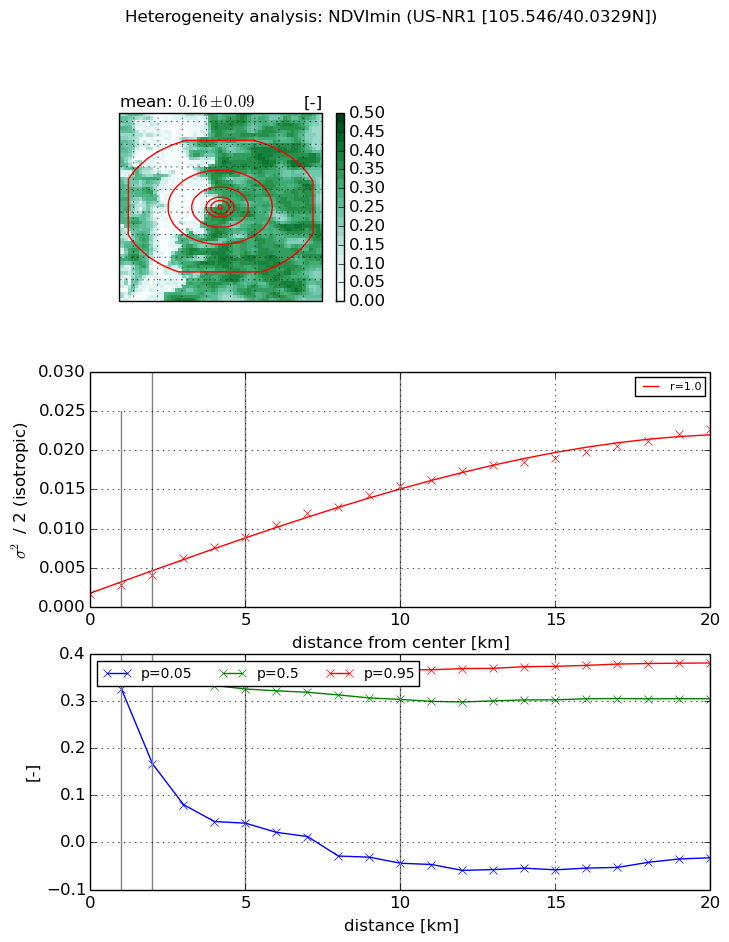
Heterogeneity analysis

The heterogeneity analysis provides information about the spatial and temporal heterogeneity of the site.

Topography


Roman et al. (2009) index


St

0.0245388130089

Rcv

0.399546856043

Rse

0.0

Rst

2.83456364969e-06

Rsv

121.855752508


Height range @ 1km [m]

219

Height range @ 2km [m]

379

Height range @ 5km [m]

784

Height range @ 10km [m]

-999

Height range @ 20km [m]

-999


Variance slope @ 1 km

6420

Variance slope @ 2 km

7859

Variance slope @ 5 km

11486

Variance slope @ 10 km

-999

Variance slope @ 20 km

-999


NDVI (max. NDVI composite)


Roman et al. (2009) index


St

17.6563009554

Rcv

0.0895620976421

Rse

0.0

Rst

-0.028820317329

Rsv

0.0515285990954


NDVI range @ 1km [-]

0.02

NDVI range @ 2km [-]

0.06

NDVI range @ 5km [-]

0.09

NDVI range @ 10km [-]

0.33

NDVI range @ 20km [-]

0.26


Variance slope @ 1 km

0.000557541050925

Variance slope @ 2 km

0.000612408550328

Variance slope @ 5 km

0.000782561466821

Variance slope @ 10 km

0.000649336416528

Variance slope @ 20 km

0.000273209848191


NDVI (min. NDVI composite)I


Roman et al. (2009) index


St

3.26824221199

Rcv

0.333812680074

Rse

0.0

Rst

-0.0913128798809

Rsv

0.49279906295


NDVI range @ 1km [-]

0.04

NDVI range @ 2km [-]

0.2

NDVI range @ 5km [-]

0.33

NDVI range @ 10km [-]

0.41

NDVI range @ 20km [-]

0.41


NDVI slope @ 1 km

0.0012388613181

NDVI slope @ 2 km

0.00125354921719

NDVI slope @ 5 km

0.00151201184318

NDVI slope @ 10 km

0.00141121240453

NDVI slope @ 20 km

0.00104557831023


Temporal stability analysis

+000 deg (BHR)


BHR statistics

Temporal stability [1/decade]:


abs

rel


Weighted least square:

None


Ordinary least square:

None


Probabilities that GCOS criteria is met:

Weighted least square:

None %

Ordinary least square:

None %


DHR statistics

Temporal stability [1/decade]:


abs

rel


Weighted least square:

None


Ordinary least square:

None


Probabilities that GCOS criteria is met:

Weighted least square:

None %

Ordinary least square:

None %


+057/+063 deg (BHR)


BHR statistics

Temporal stability [1/decade]:


abs

rel


Weighted least square:

None


Ordinary least square:

None


Probabilities that GCOS criteria is met:

Weighted least square:

None %

Ordinary least square:

None %


DHR statistics

Temporal stability [1/decade]:


abs

rel


Weighted least square:

None


Ordinary least square:

None


Probabilities that GCOS criteria is met:

Weighted least square:

None %

Ordinary least square:

None %


Temporal anomaly analyis

The variance of the temporal anomalies provides an additional measure about the stability of the signal AFTER removal of the mean seasonal cylce.

+000 deg


+057/+063 deg