US-SO2


Location

lon / lat [deg]: -116.6229 / 33.3739

Source network: FLUXNET


Geostationary surface albedo (GSA) data


“+000”


“+057/+063”


Landcover information (based on ESA CCI landcover data)


Landcover fractions @ 2km distance


Landcover fractions @ 20 km distance


Legend


Distance to open water bodies [km]:

17.74

Distance to urban areas [km]:

9.64


Radius: 1 km

Number of landcover classes:

3

Dominant landcover type:

120: Shrubland

Fraction of dominant landcover type [%]:

79.0


Radius: 2 km

Number of landcover classes:

4

Dominant landcover type:

120: Shrubland

Fraction of dominant landcover type [%]:

50.0


Radius: 5 km

Number of landcover classes:

4

Dominant landcover type:

70: Tree cover, needleleaved, evergreen, closed to open (>15%)

Fraction of dominant landcover type [%]:

52.0


Radius: 10 km

Number of landcover classes:

3

Dominant landcover type:

70: Tree cover, needleleaved, evergreen, closed to open (>15%)

Fraction of dominant landcover type [%]:

49.0


Radius: 20 km

Number of landcover classes:

3

Dominant landcover type:

120: Shrubland

Fraction of dominant landcover type [%]:

61.0


Disturbances


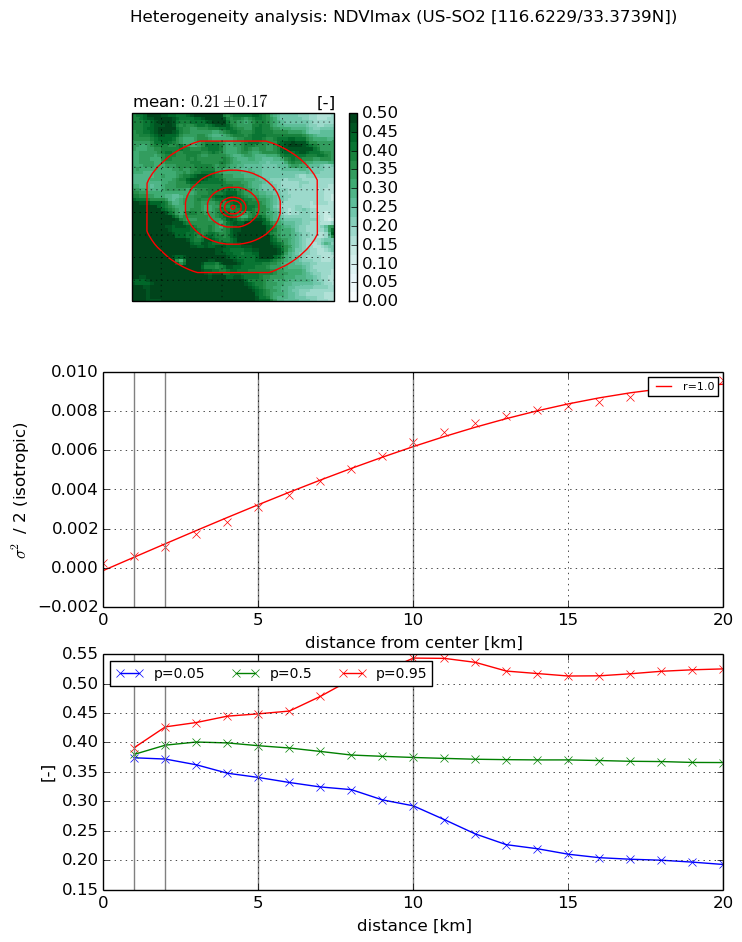
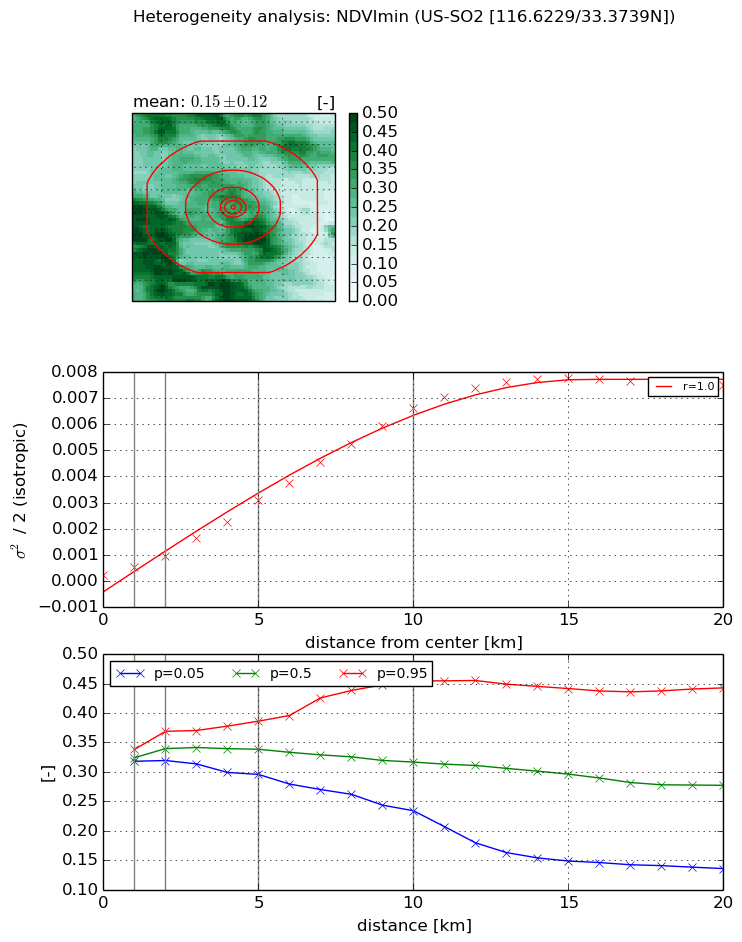
Heterogeneity analysis

The heterogeneity analysis provides information about the spatial and temporal heterogeneity of the site.

Topography


Roman et al. (2009) index


St

0.194745914456

Rcv

0.248822512239

Rse

0.0

Rst

-4.60815202887e-07

Rsv

15.1558647626


Height range @ 1km [m]

110

Height range @ 2km [m]

235

Height range @ 5km [m]

512

Height range @ 10km [m]

-999

Height range @ 20km [m]

-999


Variance slope @ 1 km

5555

Variance slope @ 2 km

6315

Variance slope @ 5 km

4555

Variance slope @ 10 km

-999

Variance slope @ 20 km

-999


NDVI (max. NDVI composite)


Roman et al. (2009) index


St

7.09236304637

Rcv

0.358002065857

Rse

0.0

Rst

0.00701168480979

Rsv

-0.0579764403865


NDVI range @ 1km [-]

0.02

NDVI range @ 2km [-]

0.05

NDVI range @ 5km [-]

0.11

NDVI range @ 10km [-]

0.25

NDVI range @ 20km [-]

0.33


Variance slope @ 1 km

0.000353493739742

Variance slope @ 2 km

0.000406067381528

Variance slope @ 5 km

0.000574327181114

Variance slope @ 10 km

0.000636565423372

Variance slope @ 20 km

0.000492872270802


NDVI (min. NDVI composite)I


Roman et al. (2009) index


St

5.6091330553

Rcv

0.449820107039

Rse

0.0

Rst

-0.0363929138118

Rsv

0.048628989567


NDVI range @ 1km [-]

0.02

NDVI range @ 2km [-]

0.05

NDVI range @ 5km [-]

0.09

NDVI range @ 10km [-]

0.22

NDVI range @ 20km [-]

0.31


NDVI slope @ 1 km

0.000321640468404

NDVI slope @ 2 km

0.00037728835195

NDVI slope @ 5 km

0.000576059074985

NDVI slope @ 10 km

0.000669855089451

NDVI slope @ 20 km

0.000412373057087


Temporal stability analysis

+000 deg (BHR)


BHR statistics

Temporal stability [1/decade]:


abs

rel


Weighted least square:

None


Ordinary least square:

None


Probabilities that GCOS criteria is met:

Weighted least square:

None %

Ordinary least square:

None %


DHR statistics

Temporal stability [1/decade]:


abs

rel


Weighted least square:

None


Ordinary least square:

None


Probabilities that GCOS criteria is met:

Weighted least square:

None %

Ordinary least square:

None %


+057/+063 deg (BHR)


BHR statistics

Temporal stability [1/decade]:


abs

rel


Weighted least square:

None


Ordinary least square:

None


Probabilities that GCOS criteria is met:

Weighted least square:

None %

Ordinary least square:

None %


DHR statistics

Temporal stability [1/decade]:


abs

rel


Weighted least square:

None


Ordinary least square:

None


Probabilities that GCOS criteria is met:

Weighted least square:

None %

Ordinary least square:

None %


Temporal anomaly analyis

The variance of the temporal anomalies provides an additional measure about the stability of the signal AFTER removal of the mean seasonal cylce.

+000 deg


+057/+063 deg