US-SO4


Location

lon / lat [deg]: -116.6403 / 33.3844

Source network: FLUXNET


Geostationary surface albedo (GSA) data


“+000”


“+057/+063”


Landcover information (based on ESA CCI landcover data)


Landcover fractions @ 2km distance


Landcover fractions @ 20 km distance


Legend


Distance to open water bodies [km]:

17.78

Distance to urban areas [km]:

8.65


Radius: 1 km

Number of landcover classes:

4

Dominant landcover type:

120: Shrubland

Fraction of dominant landcover type [%]:

46.0


Radius: 2 km

Number of landcover classes:

4

Dominant landcover type:

70: Tree cover, needleleaved, evergreen, closed to open (>15%)

Fraction of dominant landcover type [%]:

46.0


Radius: 5 km

Number of landcover classes:

3

Dominant landcover type:

70: Tree cover, needleleaved, evergreen, closed to open (>15%)

Fraction of dominant landcover type [%]:

55.0


Radius: 10 km

Number of landcover classes:

3

Dominant landcover type:

70: Tree cover, needleleaved, evergreen, closed to open (>15%)

Fraction of dominant landcover type [%]:

48.0


Radius: 20 km

Number of landcover classes:

3

Dominant landcover type:

120: Shrubland

Fraction of dominant landcover type [%]:

59.0


Disturbances


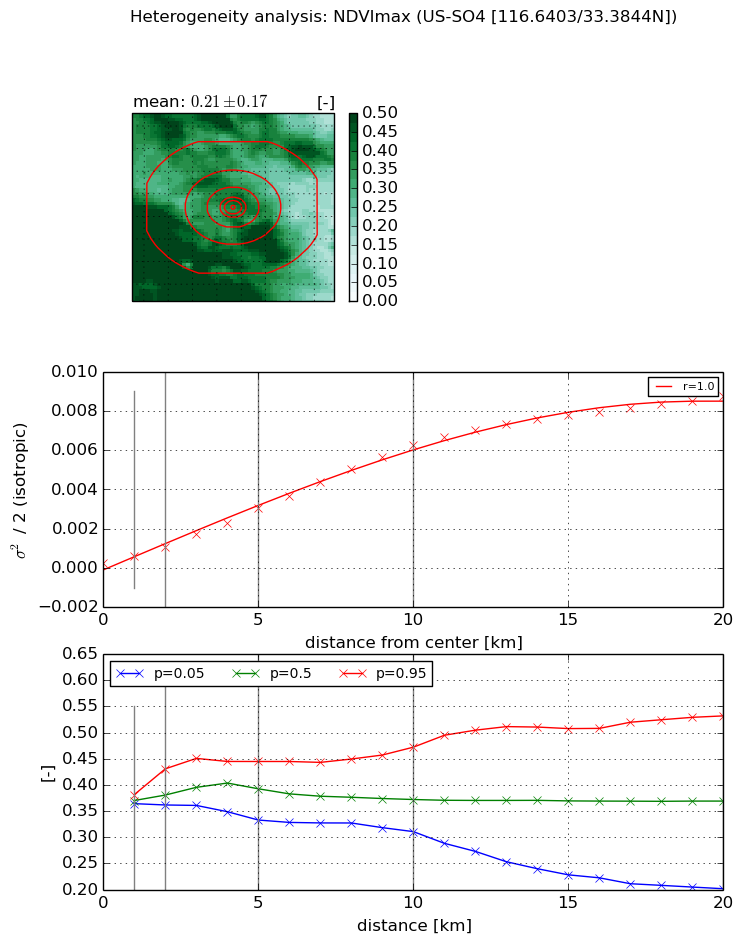
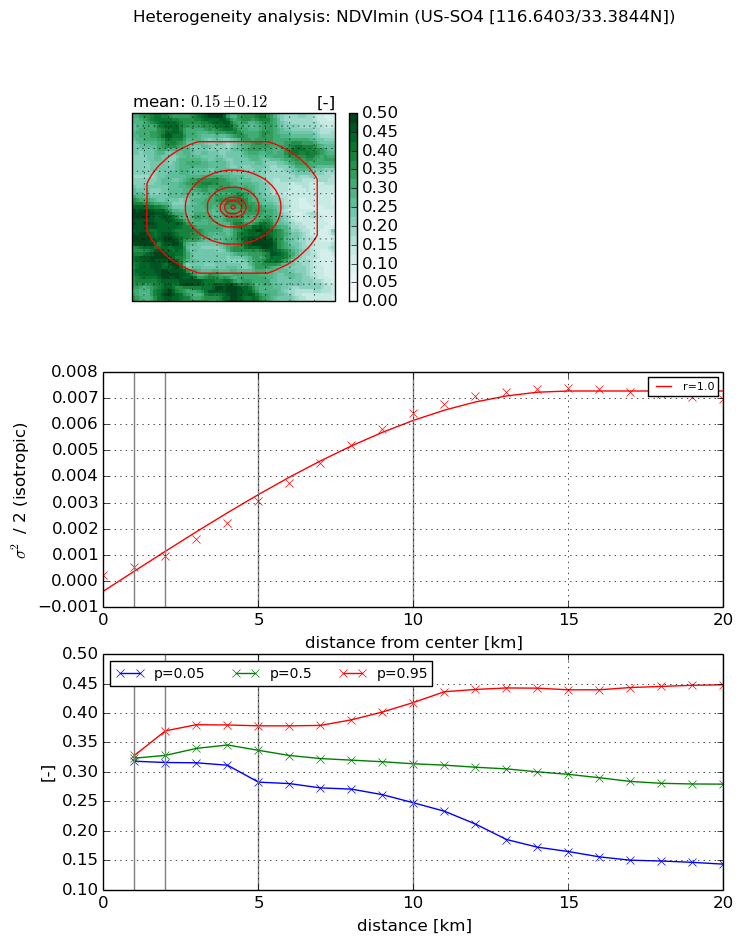
Heterogeneity analysis

The heterogeneity analysis provides information about the spatial and temporal heterogeneity of the site.

Topography


Roman et al. (2009) index


St

5.44838789966

Rcv

0.165493752489

Rse

0.0

Rst

-8.71335663635e-08

Rsv

0.385127748864


Height range @ 1km [m]

90

Height range @ 2km [m]

275

Height range @ 5km [m]

511

Height range @ 10km [m]

-999

Height range @ 20km [m]

-999


Variance slope @ 1 km

4419

Variance slope @ 2 km

4980

Variance slope @ 5 km

4292

Variance slope @ 10 km

-999

Variance slope @ 20 km

-999


NDVI (max. NDVI composite)


Roman et al. (2009) index


St

4.34052760161

Rcv

0.198245387244

Rse

0.0

Rst

-0.121835347359

Rsv

0.371079482622


NDVI range @ 1km [-]

0.02

NDVI range @ 2km [-]

0.07

NDVI range @ 5km [-]

0.11

NDVI range @ 10km [-]

0.16

NDVI range @ 20km [-]

0.33


Variance slope @ 1 km

0.000350691097842

Variance slope @ 2 km

0.000400818813496

Variance slope @ 5 km

0.000565043967271

Variance slope @ 10 km

0.00062779232882

Variance slope @ 20 km

0.000450540748925


NDVI (min. NDVI composite)I


Roman et al. (2009) index


St

3.4645594149

Rcv

0.318640825362

Rse

0.0

Rst

-0.146092021245

Rsv

0.40117812236


NDVI range @ 1km [-]

0.01

NDVI range @ 2km [-]

0.05

NDVI range @ 5km [-]

0.1

NDVI range @ 10km [-]

0.17

NDVI range @ 20km [-]

0.3


NDVI slope @ 1 km

0.000311019699108

NDVI slope @ 2 km

0.000363406465845

NDVI slope @ 5 km

0.000566764898496

NDVI slope @ 10 km

0.000656579710897

NDVI slope @ 20 km

0.000383044348784


Temporal stability analysis

+000 deg (BHR)


BHR statistics

Temporal stability [1/decade]:


abs

rel


Weighted least square:

None


Ordinary least square:

None


Probabilities that GCOS criteria is met:

Weighted least square:

None %

Ordinary least square:

None %


DHR statistics

Temporal stability [1/decade]:


abs

rel


Weighted least square:

None


Ordinary least square:

None


Probabilities that GCOS criteria is met:

Weighted least square:

None %

Ordinary least square:

None %


+057/+063 deg (BHR)


BHR statistics

Temporal stability [1/decade]:


abs

rel


Weighted least square:

None


Ordinary least square:

None


Probabilities that GCOS criteria is met:

Weighted least square:

None %

Ordinary least square:

None %


DHR statistics

Temporal stability [1/decade]:


abs

rel


Weighted least square:

None


Ordinary least square:

None


Probabilities that GCOS criteria is met:

Weighted least square:

None %

Ordinary least square:

None %


Temporal anomaly analyis

The variance of the temporal anomalies provides an additional measure about the stability of the signal AFTER removal of the mean seasonal cylce.

+000 deg


+057/+063 deg