US-SRM


Location

lon / lat [deg]: -110.866 / 31.8214

Source network: FLUXNET


Geostationary surface albedo (GSA) data


“+000”


“+057/+063”


Landcover information (based on ESA CCI landcover data)


Landcover fractions @ 2km distance


Landcover fractions @ 20 km distance


Legend


Distance to open water bodies [km]:

8.1

Distance to urban areas [km]:

9.66


Radius: 1 km

Number of landcover classes:

1

Dominant landcover type:

120: Shrubland

Fraction of dominant landcover type [%]:

100.0


Radius: 2 km

Number of landcover classes:

1

Dominant landcover type:

120: Shrubland

Fraction of dominant landcover type [%]:

100.0


Radius: 5 km

Number of landcover classes:

1

Dominant landcover type:

120: Shrubland

Fraction of dominant landcover type [%]:

100.0


Radius: 10 km

Number of landcover classes:

3

Dominant landcover type:

120: Shrubland

Fraction of dominant landcover type [%]:

87.0


Radius: 20 km

Number of landcover classes:

6

Dominant landcover type:

120: Shrubland

Fraction of dominant landcover type [%]:

76.0


Disturbances


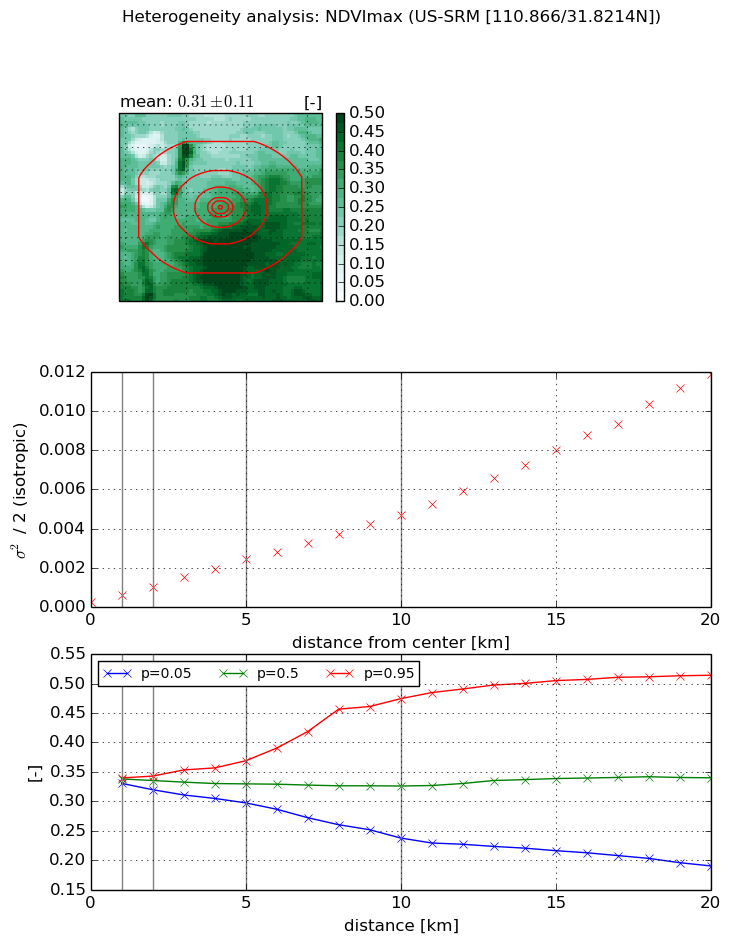
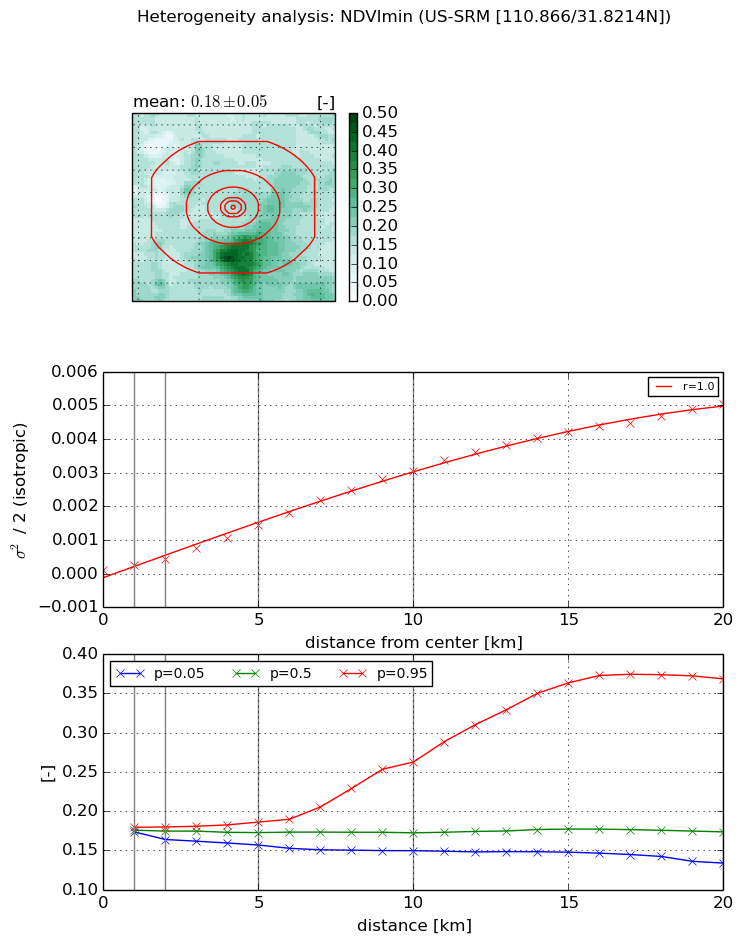
Heterogeneity analysis

The heterogeneity analysis provides information about the spatial and temporal heterogeneity of the site.

Topography


Roman et al. (2009) index


St

3.06001342289

Rcv

0.756895437547

Rse

0.0

Rst

0.0

Rsv

0.223492418781


Height range @ 1km [m]

51

Height range @ 2km [m]

101

Height range @ 5km [m]

267

Height range @ 10km [m]

-999

Height range @ 20km [m]

-999


Variance slope @ 1 km

466

Variance slope @ 2 km

731

Variance slope @ 5 km

1499

Variance slope @ 10 km

-999

Variance slope @ 20 km

-999


NDVI (max. NDVI composite)


Roman et al. (2009) index


St

3.26533466072

Rcv

0.706456406205

Rse

0.0

Rst

-4.71387057326e-09

Rsv

-0.21228555942


NDVI range @ 1km [-]

0.01

NDVI range @ 2km [-]

0.02

NDVI range @ 5km [-]

0.07

NDVI range @ 10km [-]

0.24

NDVI range @ 20km [-]

0.32


Variance slope @ 1 km

0.000370346803047

Variance slope @ 2 km

0.000386977342298

Variance slope @ 5 km

0.000442817569845

Variance slope @ 10 km

0.000448863368748

Variance slope @ 20 km

0.000574904071677


NDVI (min. NDVI composite)I


Roman et al. (2009) index


St

0.161256674802

Rcv

0.395202259916

Rse

0.0

Rst

2.32748469538e-07

Rsv

18.2086785789


NDVI range @ 1km [-]

0.01

NDVI range @ 2km [-]

0.02

NDVI range @ 5km [-]

0.03

NDVI range @ 10km [-]

0.11

NDVI range @ 20km [-]

0.23


NDVI slope @ 1 km

0.000149452422721

NDVI slope @ 2 km

0.000174306206598

NDVI slope @ 5 km

0.000271330132499

NDVI slope @ 10 km

0.000315882732217

NDVI slope @ 20 km

0.000262022769762


Temporal stability analysis

+000 deg (BHR)


BHR statistics

Temporal stability [1/decade]:


abs

rel


Weighted least square:

None


Ordinary least square:

None


Probabilities that GCOS criteria is met:

Weighted least square:

None %

Ordinary least square:

None %


DHR statistics

Temporal stability [1/decade]:


abs

rel


Weighted least square:

None


Ordinary least square:

None


Probabilities that GCOS criteria is met:

Weighted least square:

None %

Ordinary least square:

None %


+057/+063 deg (BHR)


BHR statistics

Temporal stability [1/decade]:


abs

rel


Weighted least square:

None


Ordinary least square:

None


Probabilities that GCOS criteria is met:

Weighted least square:

None %

Ordinary least square:

None %


DHR statistics

Temporal stability [1/decade]:


abs

rel


Weighted least square:

None


Ordinary least square:

None


Probabilities that GCOS criteria is met:

Weighted least square:

None %

Ordinary least square:

None %


Temporal anomaly analyis

The variance of the temporal anomalies provides an additional measure about the stability of the signal AFTER removal of the mean seasonal cylce.

+000 deg


+057/+063 deg