US-SYV


Location

lon / lat [deg]: -89.3477 / 46.242

Source network: FLUXNET


Geostationary surface albedo (GSA) data


“+000”


“+057/+063”


Landcover information (based on ESA CCI landcover data)


Landcover fractions @ 2km distance


Landcover fractions @ 20 km distance


Legend


Distance to open water bodies [km]:

0.19

Distance to urban areas [km]:

7.93


Radius: 1 km

Number of landcover classes:

5

Dominant landcover type:

90: Tree cover, mixed leaf type

Fraction of dominant landcover type [%]:

63.0


Radius: 2 km

Number of landcover classes:

7

Dominant landcover type:

90: Tree cover, mixed leaf type

Fraction of dominant landcover type [%]:

46.0


Radius: 5 km

Number of landcover classes:

7

Dominant landcover type:

90: Tree cover, mixed leaf type

Fraction of dominant landcover type [%]:

38.0


Radius: 10 km

Number of landcover classes:

7

Dominant landcover type:

90: Tree cover, mixed leaf type

Fraction of dominant landcover type [%]:

33.0


Radius: 20 km

Number of landcover classes:

7

Dominant landcover type:

90: Tree cover, mixed leaf type

Fraction of dominant landcover type [%]:

29.0


Disturbances


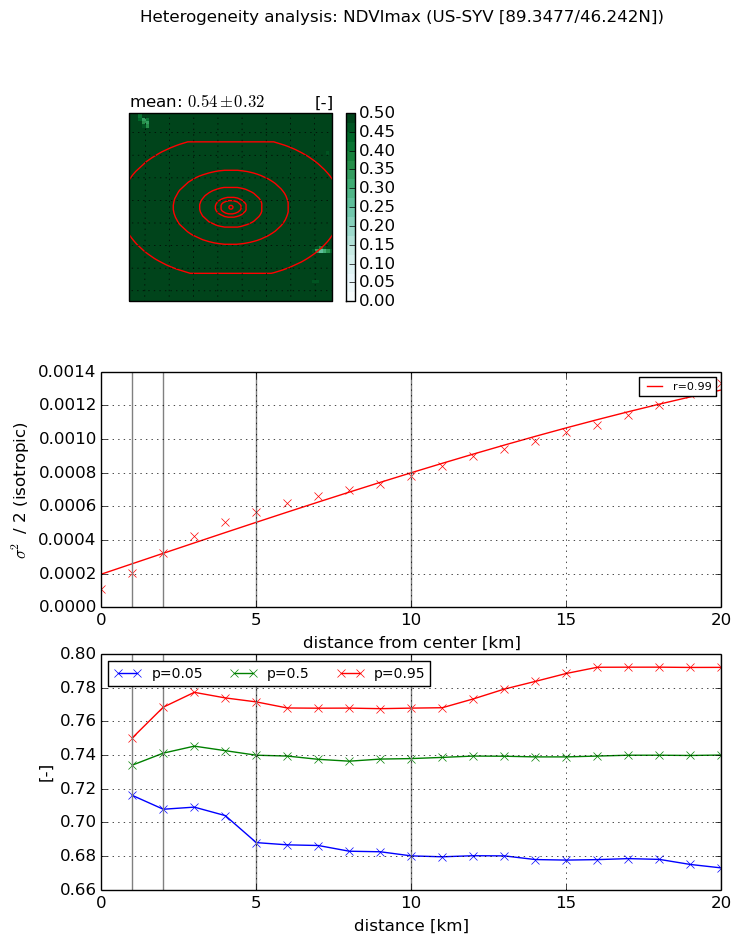
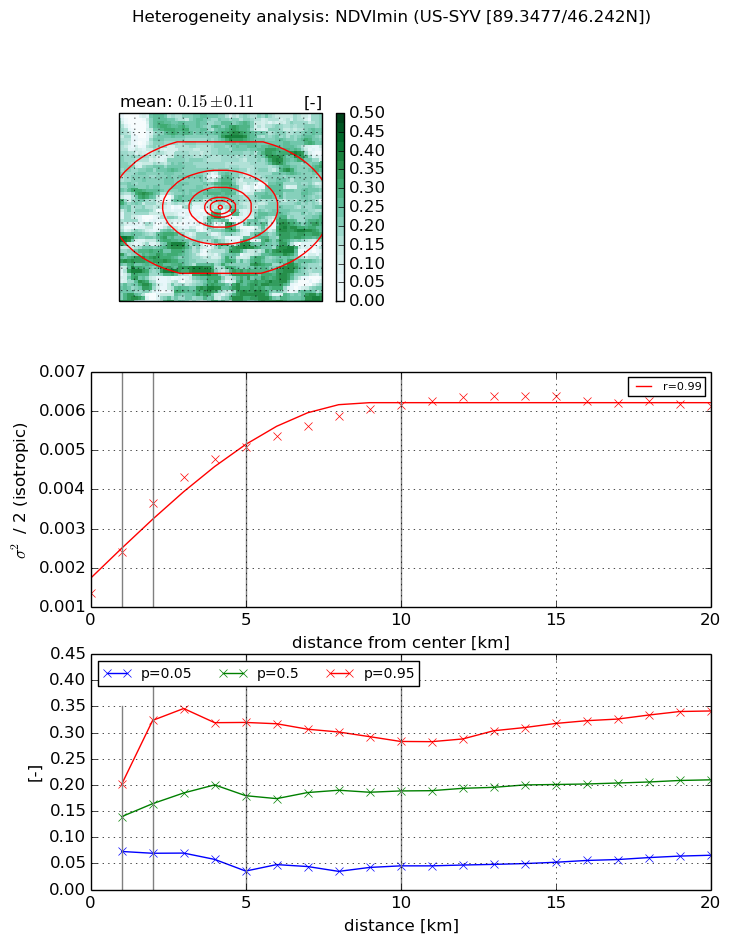
Heterogeneity analysis

The heterogeneity analysis provides information about the spatial and temporal heterogeneity of the site.

Topography


Roman et al. (2009) index


St

0.000230772548177

Rcv

0.183599245047

Rse

0.0

Rst

-0.0873550956287

Rsv

12999.5421677


Height range @ 1km [m]

31

Height range @ 2km [m]

33

Height range @ 5km [m]

44

Height range @ 10km [m]

-999

Height range @ 20km [m]

-999


Variance slope @ 1 km

91

Variance slope @ 2 km

62

Variance slope @ 5 km

36

Variance slope @ 10 km

-999

Variance slope @ 20 km

-999


NDVI (max. NDVI composite)


Roman et al. (2009) index


St

4.13305079322

Rcv

0.140440098001

Rse

0.0

Rst

-0.153824714981

Rsv

0.431591255597


NDVI range @ 1km [-]

0.03

NDVI range @ 2km [-]

0.06

NDVI range @ 5km [-]

0.08

NDVI range @ 10km [-]

0.09

NDVI range @ 20km [-]

0.12


Variance slope @ 1 km

8.96678751466e-05

Variance slope @ 2 km

0.000106476556565

Variance slope @ 5 km

9.37692381928e-05

Variance slope @ 10 km

6.54625868043e-05

Variance slope @ 20 km

5.54248065397e-05


NDVI (min. NDVI composite)I


Roman et al. (2009) index


St

4.59516561334

Rcv

0.166197566622

Rse

0.0

Rst

-0.133667910903

Rsv

0.352994561141


NDVI range @ 1km [-]

0.13

NDVI range @ 2km [-]

0.25

NDVI range @ 5km [-]

0.28

NDVI range @ 10km [-]

0.24

NDVI range @ 20km [-]

0.28


NDVI slope @ 1 km

0.0010600399679

NDVI slope @ 2 km

0.00114442113058

NDVI slope @ 5 km

0.000754273143203

NDVI slope @ 10 km

0.000440452441253

NDVI slope @ 20 km

0.000180044256162


Temporal stability analysis

+000 deg (BHR)


BHR statistics

Temporal stability [1/decade]:


abs

rel


Weighted least square:

None


Ordinary least square:

None


Probabilities that GCOS criteria is met:

Weighted least square:

None %

Ordinary least square:

None %


DHR statistics

Temporal stability [1/decade]:


abs

rel


Weighted least square:

None


Ordinary least square:

None


Probabilities that GCOS criteria is met:

Weighted least square:

None %

Ordinary least square:

None %


+057/+063 deg (BHR)


BHR statistics

Temporal stability [1/decade]:


abs

rel


Weighted least square:

None


Ordinary least square:

None


Probabilities that GCOS criteria is met:

Weighted least square:

None %

Ordinary least square:

None %


DHR statistics

Temporal stability [1/decade]:


abs

rel


Weighted least square:

None


Ordinary least square:

None


Probabilities that GCOS criteria is met:

Weighted least square:

None %

Ordinary least square:

None %


Temporal anomaly analyis

The variance of the temporal anomalies provides an additional measure about the stability of the signal AFTER removal of the mean seasonal cylce.

+000 deg


+057/+063 deg