US-VAR


Location

lon / lat [deg]: -120.9507 / 38.4133

Source network: FLUXNET


Geostationary surface albedo (GSA) data


“+000”


“+057/+063”


Landcover information (based on ESA CCI landcover data)


Landcover fractions @ 2km distance


Landcover fractions @ 20 km distance


Legend


Distance to open water bodies [km]:

7.19

Distance to urban areas [km]:

5.43


Radius: 1 km

Number of landcover classes:

1

Dominant landcover type:

130: grassland

Fraction of dominant landcover type [%]:

100.0


Radius: 2 km

Number of landcover classes:

3

Dominant landcover type:

130: grassland

Fraction of dominant landcover type [%]:

95.0


Radius: 5 km

Number of landcover classes:

3

Dominant landcover type:

130: grassland

Fraction of dominant landcover type [%]:

94.0


Radius: 10 km

Number of landcover classes:

2

Dominant landcover type:

130: grassland

Fraction of dominant landcover type [%]:

95.0


Radius: 20 km

Number of landcover classes:

5

Dominant landcover type:

130: grassland

Fraction of dominant landcover type [%]:

87.0


Disturbances


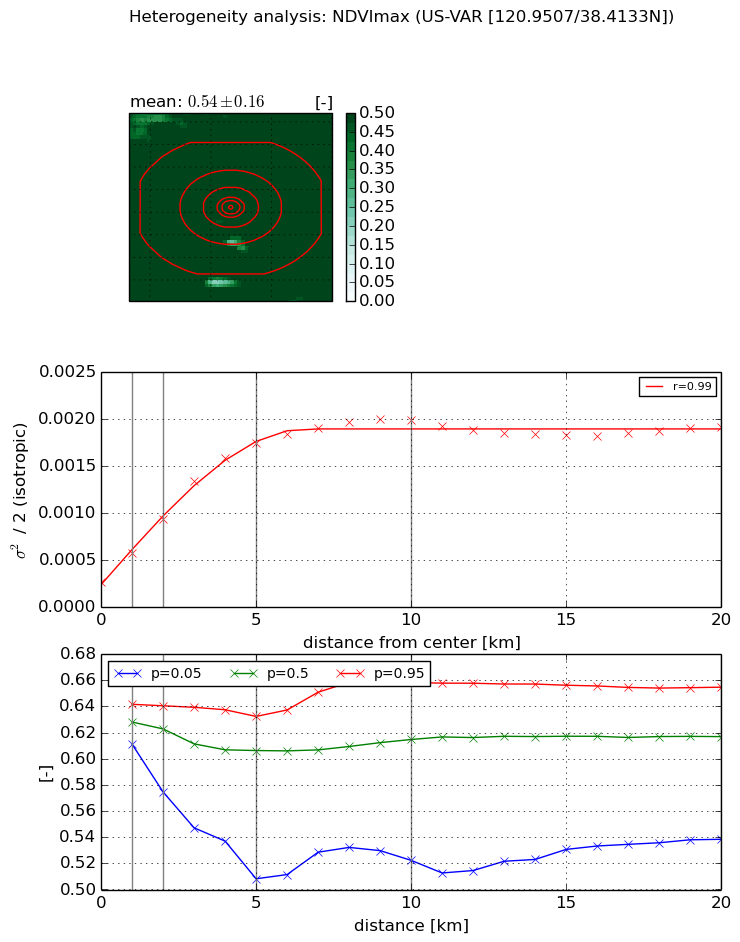
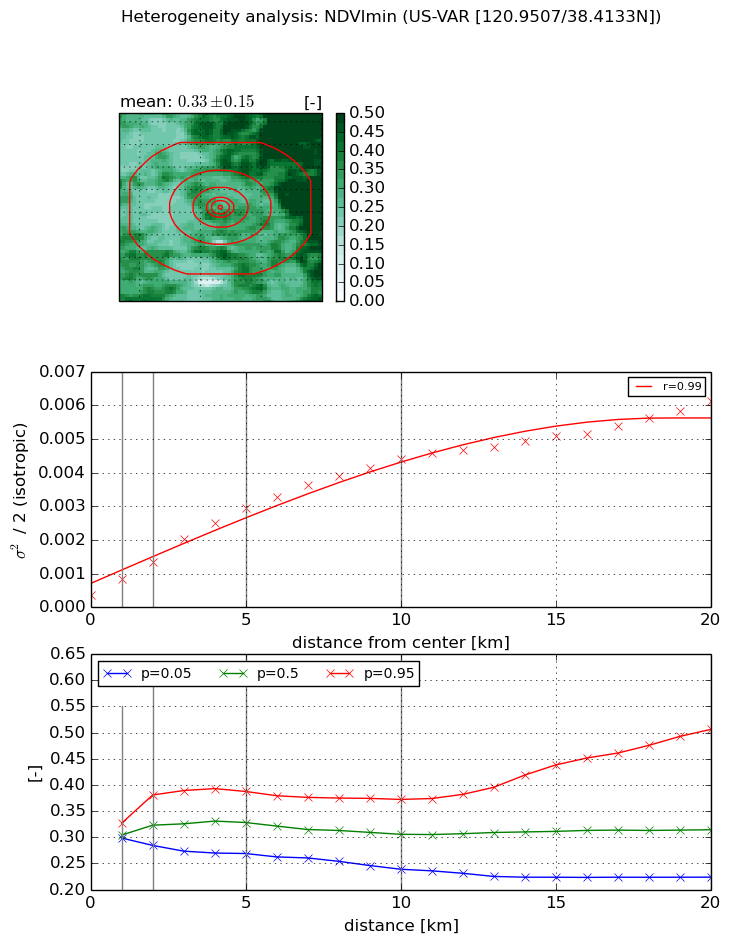
Heterogeneity analysis

The heterogeneity analysis provides information about the spatial and temporal heterogeneity of the site.

Topography


Roman et al. (2009) index


St

0.0420491458802

Rcv

0.444371375561

Rse

0.0

Rst

0.000132919609172

Rsv

70.9005833921


Height range @ 1km [m]

40

Height range @ 2km [m]

77

Height range @ 5km [m]

128

Height range @ 10km [m]

-999

Height range @ 20km [m]

-999


Variance slope @ 1 km

218

Variance slope @ 2 km

253

Variance slope @ 5 km

350

Variance slope @ 10 km

-999

Variance slope @ 20 km

-999


NDVI (max. NDVI composite)


Roman et al. (2009) index


St

1.82335402765

Rcv

0.401522836995

Rse

0.0

Rst

-0.243797039188

Rsv

-0.999999658317


NDVI range @ 1km [-]

0.03

NDVI range @ 2km [-]

0.07

NDVI range @ 5km [-]

0.12

NDVI range @ 10km [-]

0.14

NDVI range @ 20km [-]

0.12


Variance slope @ 1 km

0.000310870719458

Variance slope @ 2 km

0.000332465075242

Variance slope @ 5 km

0.000309256615782

Variance slope @ 10 km

0.000171041902332

Variance slope @ 20 km

5.30650173792e-05


NDVI (min. NDVI composite)I


Roman et al. (2009) index


St

0.366245176987

Rcv

-0.0021937968747

Rse

0.0

Rst

0.108472533051

Rsv

8.08056781733


NDVI range @ 1km [-]

0.03

NDVI range @ 2km [-]

0.1

NDVI range @ 5km [-]

0.12

NDVI range @ 10km [-]

0.13

NDVI range @ 20km [-]

0.28


NDVI slope @ 1 km

0.000452822272097

NDVI slope @ 2 km

0.000488200794369

NDVI slope @ 5 km

0.000529508785149

NDVI slope @ 10 km

0.000410379960836

NDVI slope @ 20 km

0.00025881194674


Temporal stability analysis

+000 deg (BHR)


BHR statistics

Temporal stability [1/decade]:


abs

rel


Weighted least square:

None


Ordinary least square:

None


Probabilities that GCOS criteria is met:

Weighted least square:

None %

Ordinary least square:

None %


DHR statistics

Temporal stability [1/decade]:


abs

rel


Weighted least square:

None


Ordinary least square:

None


Probabilities that GCOS criteria is met:

Weighted least square:

None %

Ordinary least square:

None %


+057/+063 deg (BHR)


BHR statistics

Temporal stability [1/decade]:


abs

rel


Weighted least square:

None


Ordinary least square:

None


Probabilities that GCOS criteria is met:

Weighted least square:

None %

Ordinary least square:

None %


DHR statistics

Temporal stability [1/decade]:


abs

rel


Weighted least square:

None


Ordinary least square:

None


Probabilities that GCOS criteria is met:

Weighted least square:

None %

Ordinary least square:

None %


Temporal anomaly analyis

The variance of the temporal anomalies provides an additional measure about the stability of the signal AFTER removal of the mean seasonal cylce.

+000 deg


+057/+063 deg